 Rimani
Condizioni di trading
Strumenti


Last week, the EUR/USD pair continued to move in a side channel. It almost tested the upper fractal 1.1917 (weekly candle from 09/06/2020) in the beginning, which was followed by a price decline, testing the lower fractal 1.1753. After testing the downside fractal, the price increased, practically closing at the entry point of the weekly candlestick. This week, the market may continue to decline.
Trend analysis.
The price from the level of 1.1838 (closing of the last weekly candlestick) may continue to decline this week, with the target of 1.1738 lower fractal (weekly candlestick from 09/06/2020). After testing this level, we can continue to work down with the target of 1.1657 - the support line (black thick line). An upward rebound is also possible from this line.
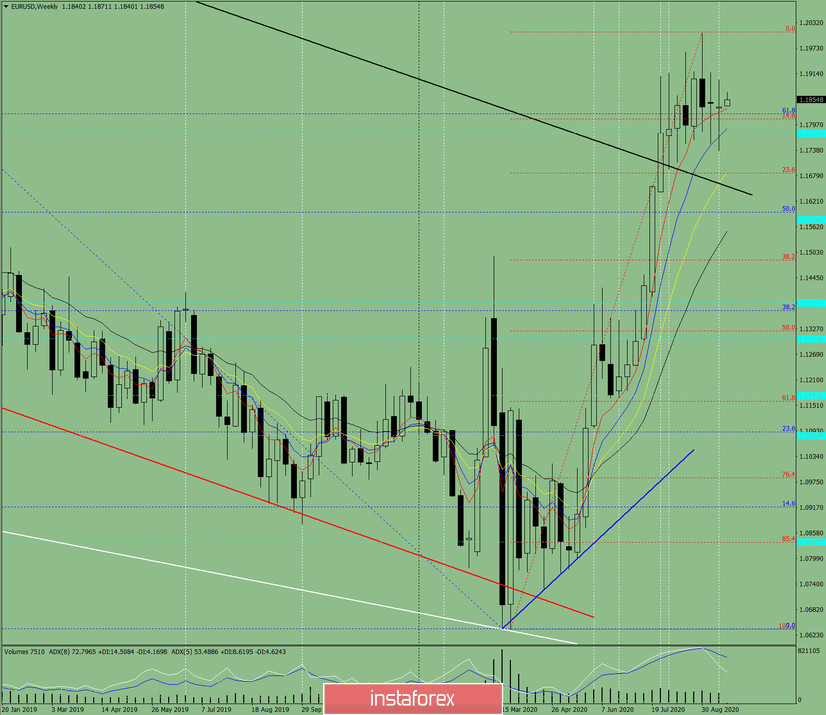
Figure: 1 (weekly chart).
Comprehensive analysis:
- indicator analysis - down;
- Fibonacci levels - down;
- volumes - down;
- candlestick analysis - neutral;
- trend analysis - down;
- Bollinger lines - up;
- monthly chart - down.
An upward movement can be concluded based on a comprehensive analysis.
The general result of the calculation of the candlestick of the EUR/USD pair according to the weekly chart: this week's price is likely to have a downward trend, with no upper shadow in the weekly black candlestick (Monday - down) and no lower shadow (Friday - down).
The first lower target is 1. 1738 - the lower fractal (weekly candle from 06.09.2020). In case of testing this level, we can continue working down with the target of 1.1657 — the support line (black bold line).
An unlikely scenario: if the price declines and reaches the historical support level of 1.1777 (blue dotted line), it is unlikely that it may start working upward, with the target at 1.2010 for an upper fractal (red dotted line).
Le recensioni analitiche di InstaForex ti renderanno pienamente consapevole delle tendenze del mercato! Essendo un cliente InstaForex, ti viene fornito un gran numero di servizi gratuiti per il trading efficiente.


