 Rimani
Condizioni di trading
Strumenti


Today, on the last day of weekly trading, we will consider an interesting cross-rate of the euro/pound. As has been repeatedly pointed out, this tool often has a serious impact on the price dynamics of the main currency pairs EUR/USD and GBP/USD. Well, let's analyze several charts of the EUR/GBP price and try to understand which direction the cross will move in the near future.
Weekly
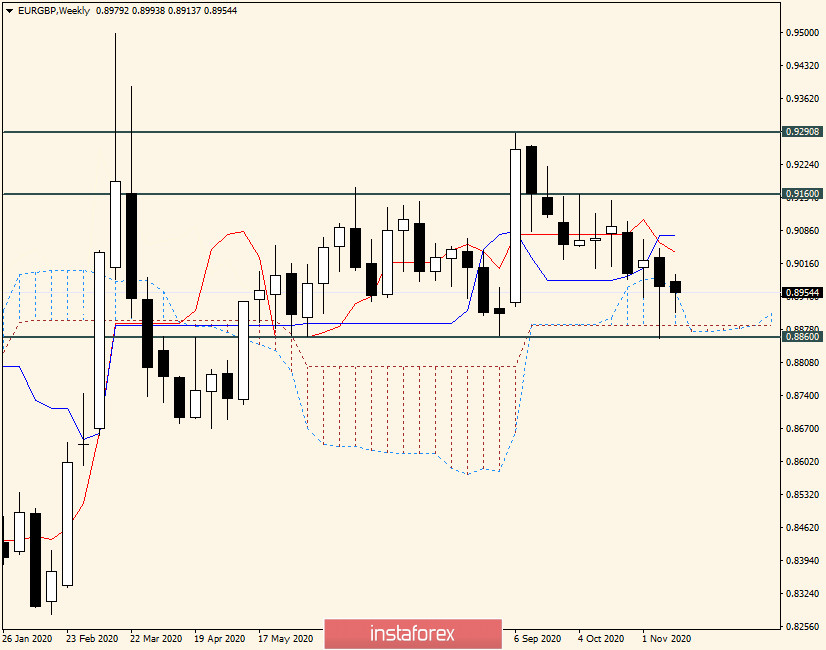
After the appearance of the previous weekly candle with a long lower shadow, it was quite possible to count on the growth of the single currency against the British pound, but this is not happening at the time of writing, and the pair has every chance to end the weekly trading with a decline.
It is worth noting that in the past week's trading, the bears' attempts to bring the price down from the Ichimoku indicator cloud ended in vain. Strong support was received at the significant technical level of 0.8860, which is where the long tail of the last weekly candle came from. The support zone can be considered 0.8887-0.8860, where the lower border of the cloud and the minimum values of previous trades pass. At the same time, the euro/pound is trading under the Tenkan and Kijun lines of the Ichimoku indicator, and this may increase the pressure on the quote. Based on this, to resume and strengthen the bullish mood, the pair's bulls need to close weekly trading above the important psychological level of 0.9000 and the marked Tenkan and Kijun lines. If this can be done, the next target for players to increase will be strong resistance from sellers near 0.9160. Today, it is unlikely that there will be enough time and effort to meet this condition, so the market will focus on the 0.9000 level and the closing price of weekly trading above or below this landmark mark.
Daily
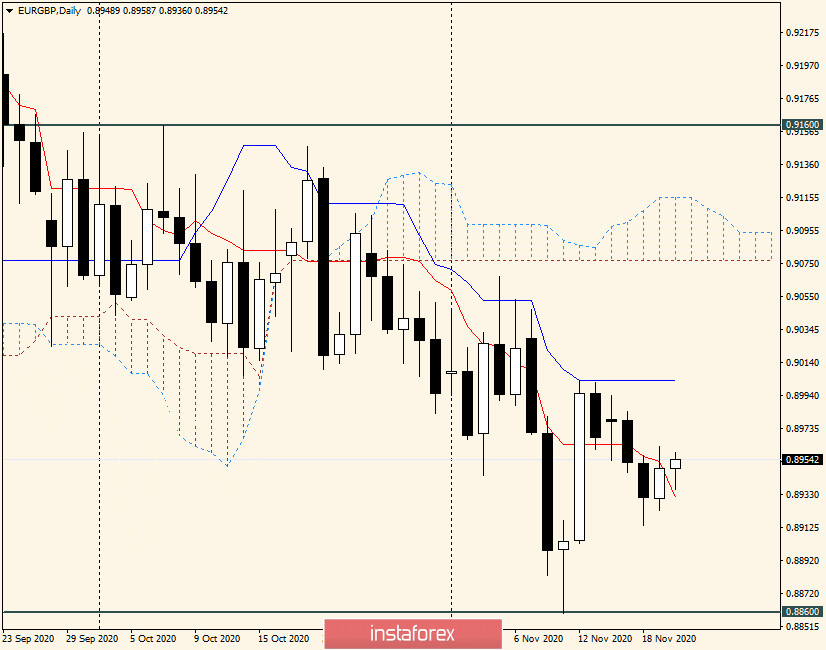
Despite the report that the seven-year budget of the European Union was not adopted at the last summit, the cross showed strengthening in yesterday's trading. Regarding the budget that was not adopted, Hungary and Poland used their veto power. Let me remind you that the EU's seven-year budget was proposed taking into account assistance to the countries most affected by the COVID-19 pandemic, and amounted to almost 2 trillion euros. Now, this issue is being dragged out, and Poland and Hungary are likely to be persuaded to refuse to block this important document and agree to accept it.
It is characteristic that this factor did not actually put any pressure on the single European currency, either in pair with the pound or in pair with the US dollar, which is very surprising. From a technical point of view, the possible growth of EUR/GBP can reach the blue Kijun line, which serves as a strong resistance. Support, in turn, is provided by the Tenkan red line, closing the day below which will increase bearish sentiment and pressure on the quote. According to trading recommendations, all attention should be paid to the 0.9000 resistance level. If this mark is broken, on a rollback to it, you can plan purchases with the nearest target in the area of 0.9080. If bearish candlestick patterns appear near 0.9000 on the four-hour and/or hourly charts, a signal will appear to open short positions with the nearest target in the area of 0.8925. In my personal opinion, a little more priority for sales, but for more accurate conclusions, you need to wait for the closing of today and all weekly trading!
Le recensioni analitiche di InstaForex ti renderanno pienamente consapevole delle tendenze del mercato! Essendo un cliente InstaForex, ti viene fornito un gran numero di servizi gratuiti per il trading efficiente.


