 Rimani
Condizioni di trading
Strumenti


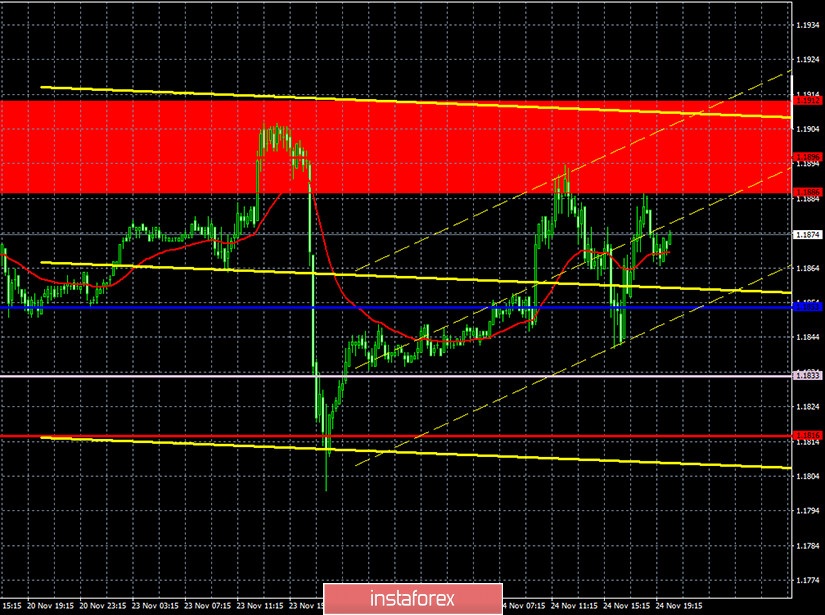
EUR/USD 1H
After failing to overcome the support level of 1.1816, the EUR/USD pair began a new round of upward movement on the hourly timeframe on Tuesday, November 24, and it reached the resistance area of 1.1886-1.1912 for the fifth time in the last seven days. And once again it could not go beyond it for the fifth time (!!!). Therefore, the price still remains within the horizontal channel of 1.1700-1.1900, in which it has been trading, except for short periods of time, for almost four (!!!) months now. Moreover, after rebounding from the 1.1886-1.1912 area, the pair began a new round of downward movement, which ended very quickly, near the critical Kijun-sen line, from which a rebound also followed and now the price rushed to the 1.1886-1.1912 again. In general, what is happening with the euro/dollar pair is beyond human understanding. Nevertheless, the technical picture remains extremely simple. The pair continues to trade within the horizontal channel and that says it all. Buyers will be able to count on a new upward trend, but not before settling above 1.1886-1.1912. Until then, the bears have the best chances of going down 100-150 points.
EUR/USD 15M
The lower linear regression channel turned up on the 15-minute timeframe, but this does not mean anything right now, since the key moment is to rebound from the 1.1884-1.1912 area, which allows us to expect a new round of decline in the pair's quotes.
COT report
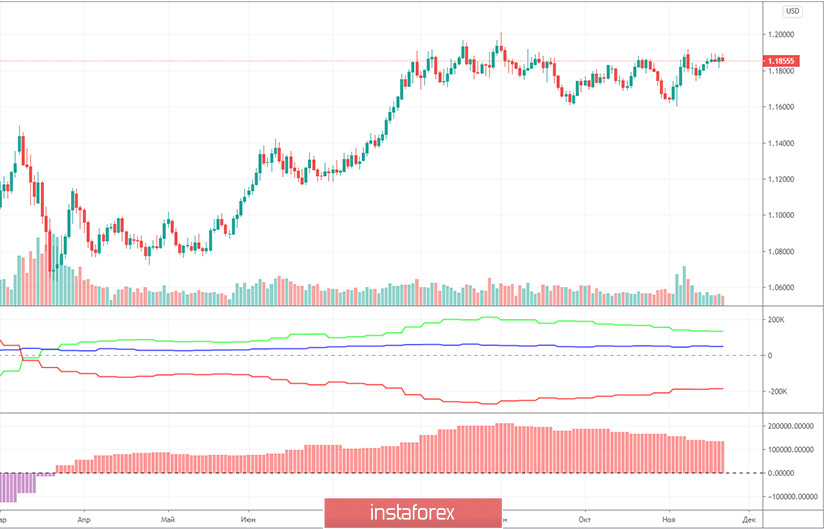
The EUR/USD pair increased by 40 points in the last reporting week (November 10-16). As you can see, price changes are still minimal. There were certain bursts of activity during the US presidential elections, but they ended very quickly and now the pair is just trading in a horizontal channel, with minimal volatility. Therefore, we expect clarification of the current situation from the Commitment of Traders (COT) reports. Unfortunately, COT reports for the last 8-10 weeks now show that non-commercial traders are reducing their net position. This means that their sentiment is becoming more bearish. The green and red lines of the first indicator show the net positions of commercial and non-commercial traders, and when they are far from each other, this is considered a strong signal for a trend change. However, the lines have moved away and they have been moving towards each other for two months now. There is no downward trend. The "non-commercial" group of traders, which is the most important and significant, opened 2,000 Buy-contracts (longs) and 1,500 Sell-contracts (shorts) for the euro during the reporting week. Therefore, there is simply no change in the mood of this group of traders. We are much less interested in other groups of traders. In general, we have a somewhat paradoxical situation, as professional traders have been reducing the number of purchases of the euro currency and increasing sales for more than two months, but the euro does not fall. Nevertheless, based on the data of the report, we still believe that the peak of the entire upward trend was near the 1.2000 level and sooner or later the downward movement will start.
A rather important GDP indicator was published in Germany on Tuesday. Significant enough for Germany, but not for the euro. This indicator increased in the third quarter by 8.5% q/q, instead of the expected +8.2%. However, it is absolutely impossible to link this report with the pair's movements. Perhaps, the report provided some kind of support to the euro, but what's the point if the euro started to fall in just a few hours, and the 1.1886-1.1912 area remained unresolved? No other news during the day.
No important macroeconomic report from the European Union on Wednesday, November 25. However, the US will release several reports. First, the annual GDP data for the third quarter. Second, orders for durable goods. Third, the personal income and expenses of the US population. Fourth, applications for unemployment benefits. Unfortunately, the market will likely ignore almost all or all of these reports. Traders already know the GDP value, since this is the third estimate. Personal income and expenses with claims for unemployment benefits are not the data that market participants are currently interested in. Durable goods orders can affect the pair's movement only if the real values differ greatly from the forecasted ones.
We have two trading ideas for November 25:
1) Buyers failed to go beyond the resistance area of 1.1886-1.1912. Although, they had five attempts to do so. Therefore, you are advised to open new long positions while aiming for the resistance levels of 1.1935 and 1.1976 if the price still settles above the 1.1886-1.1912 area. Take Profit in this case will be no more than 55 points.
2) Bears keep the pair within the horizontal channel and refuse to allow buyers to take it out of it. Therefore, you are advised to open new sell orders while aiming for the support levels of 1.1816 and 1.1775 if the price settles below the Senkou Span B line (1.1833). Take Profit in this case can be up to 50 points.
Forecast and trading signals for GBP/USD
Explanations for illustrations:
Support and Resistance Levels are the levels that serve as targets when buying or selling the pair. You can place Take Profit near these levels.
Kijun-sen and Senkou Span B lines are lines of the Ichimoku indicator transferred to the hourly timeframe from the 4-hour one.
Support and resistance areas are areas from which the price has repeatedly rebounded off.
Yellow lines are trend lines, trend channels and any other technical patterns.
Indicator 1 on the COT charts is the size of the net position of each category of traders.
Indicator 2 on the COT charts is the size of the net position for the "non-commercial" group.
Le recensioni analitiche di InstaForex ti renderanno pienamente consapevole delle tendenze del mercato! Essendo un cliente InstaForex, ti viene fornito un gran numero di servizi gratuiti per il trading efficiente.

