 Rimani
Condizioni di trading
Strumenti


GBP/USD 15M
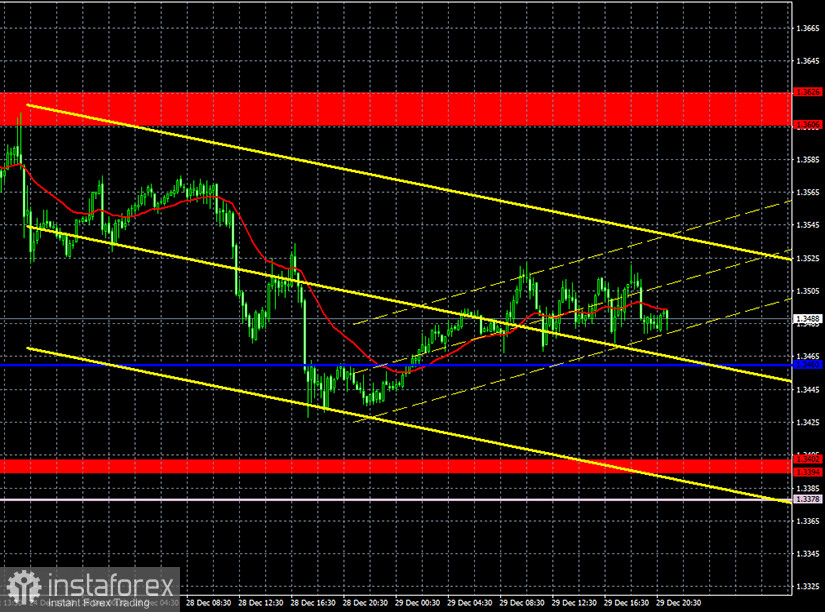
The higher linear regression channel reversed to the downside on the 15-minute timeframe, while the lower one turned to the upside. Thus, a new upward trend has begun in the short-term, and it can also be very short-lived. We believe that the pair will make another attempt to overcome the critical line. Good luck.
GBP/USD 1H
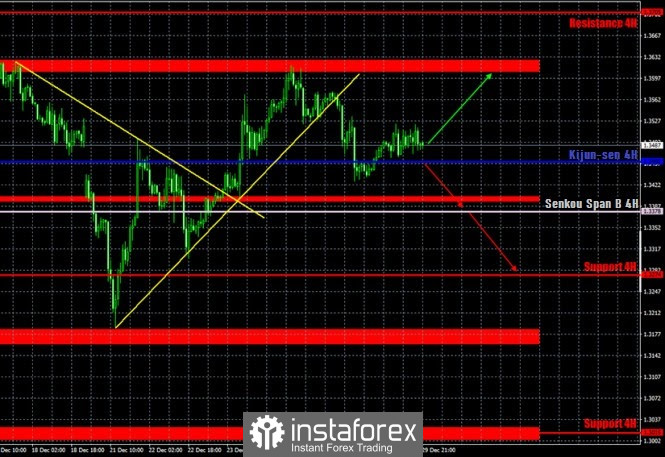
The GBP/USD pair completed the correction on Tuesday and tried to go back to moving up, failing to clearly overcome the critical Kijun-sen line. However, the trend for the pound/dollar pair has already changed to a downward one in any case, as earlier quotes had settled below the upward trend line. So now we are waiting for the price to settle below the Kijun-sen line, which will make it possible for the pair to continue the downward movement. We draw your attention to the fact that quotes rebounded from the 1.3606-1.3626 area twice, which led to forming a Double Top pattern and also increases the likelihood of creating a downward trend. But at the same time, the demand for the British currency remains high, respectively, a correction by 180 points down cannot be considered the beginning of a downward trend. Especially if the price continues to be above both the Senkou Span B and Kijun-sen lines. Nevertheless, the pair still has a certain downside potential. Around 150-200 points. Within the framework of the high volatility swing that has been observed in recent weeks.
COT report
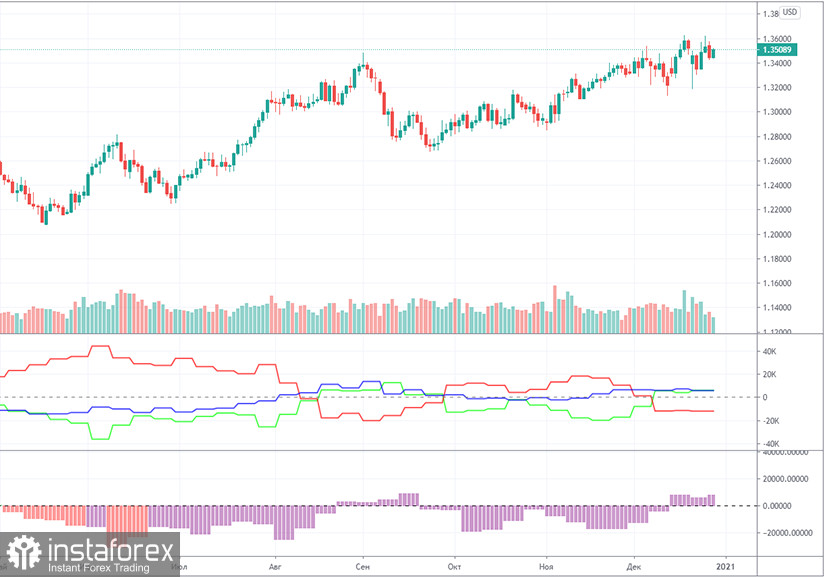
The GBP/USD pair increased by 140 points during the last reporting week (December 15-21). Thus, we can conclude that the upward trend in the pound is definitely preserved. If the penultimate Commitment of Traders (COT) report showed that professional traders closed both Buy and Sell contracts, then the latest report witnessed the opening of new contracts, but in minimal quantities. In general, changes in the number of open/closed contracts in recent months are minimal for big traders of the pound. The non-commercial group opened a total of 2,163 Buy-contracts (longs) and 442 Sell-contracts (shorts). Thus, this group of traders became more bullish. Actually, the upward movement in the pound is also preserved, so at this time everything is logical. The problem is that the advantage of longs over shorts is not that great. That is, we cannot conclude that buyers absolutely dominate the market, and therefore the pound has been growing for nine consecutive months. Indicators do not show anything good at all. It is worth looking at the first indicator in order to understand what kind of confusion is happening in the camp of professional players. Their mood is constantly changing. The green and red lines constantly change direction and intersect. Thus, no long-term conclusions can be drawn from the COT report.
The fundamentals for the pound were flat on Tuesday. Not a single noteworthy news. However, there is nothing surprising here, since it is New Year's week. Of course there is no news, no reports, no events. In such circumstances, we can consider the British government's decision to fight the obesity of the nation as the news of the day. Starting in April 2022, advertising of unhealthy and sugary foods will be limited, and free sugary drinks will not be refilled in catering establishments. The British will no longer hear ads like "pay for one, get two" if they are about unhealthy foods. Advertising of junk food will be banned at supermarket checkouts and store entrances. Recall that the fight against overweight in Britain began after Prime Minister Boris Johnson fell ill with the coronavirus. It is a fact that overweight people tolerate the disease, so Johnson himself began to lose weight after recovering, and also took up the health of the nation.
No major macroeconomic reports or events scheduled for today. Thus, the fundamental background will not be present.
We have two trading ideas for December 30:
1) Buyers for the pound/dollar pair stayed above the critical line and have every chance of resuming the upward trend. Thus, long positions are formally relevant above the Kijun-sen line, and you can aim for the resistance area of 1.3606-1.3626. Take Profit in this case will be up to 120 points. When opening longs, you should not forget about Stop Loss orders below the critical line.
2) Sellers have seized the initiative in the market, but gave up before the first serious obstacle. Thus, we recommend selling the pound/dollar pair while aiming for the Senkou Span B line (1.3378) and the support level of 1.3274 if the price manages to overcome the Kijun-sen line (1.3460). Take Profit in this case can range from 60 to 150 points.
Forecast and trading signals for EUR/USD
Explanations for illustrations:
Support and Resistance Levels are the levels that serve as targets when buying or selling the pair. You can place Take Profit near these levels.
Kijun-sen and Senkou Span B lines are lines of the Ichimoku indicator transferred to the hourly timeframe from the 4-hour one.
Support and resistance areas are areas from which the price has repeatedly rebounded off.
Yellow lines are trend lines, trend channels and any other technical patterns.
Indicator 1 on the COT charts is the size of the net position of each category of traders.
Indicator 2 on the COT charts is the size of the net position for the "non-commercial" group.
Le recensioni analitiche di InstaForex ti renderanno pienamente consapevole delle tendenze del mercato! Essendo un cliente InstaForex, ti viene fornito un gran numero di servizi gratuiti per il trading efficiente.


