 Rimani
Condizioni di trading
Strumenti


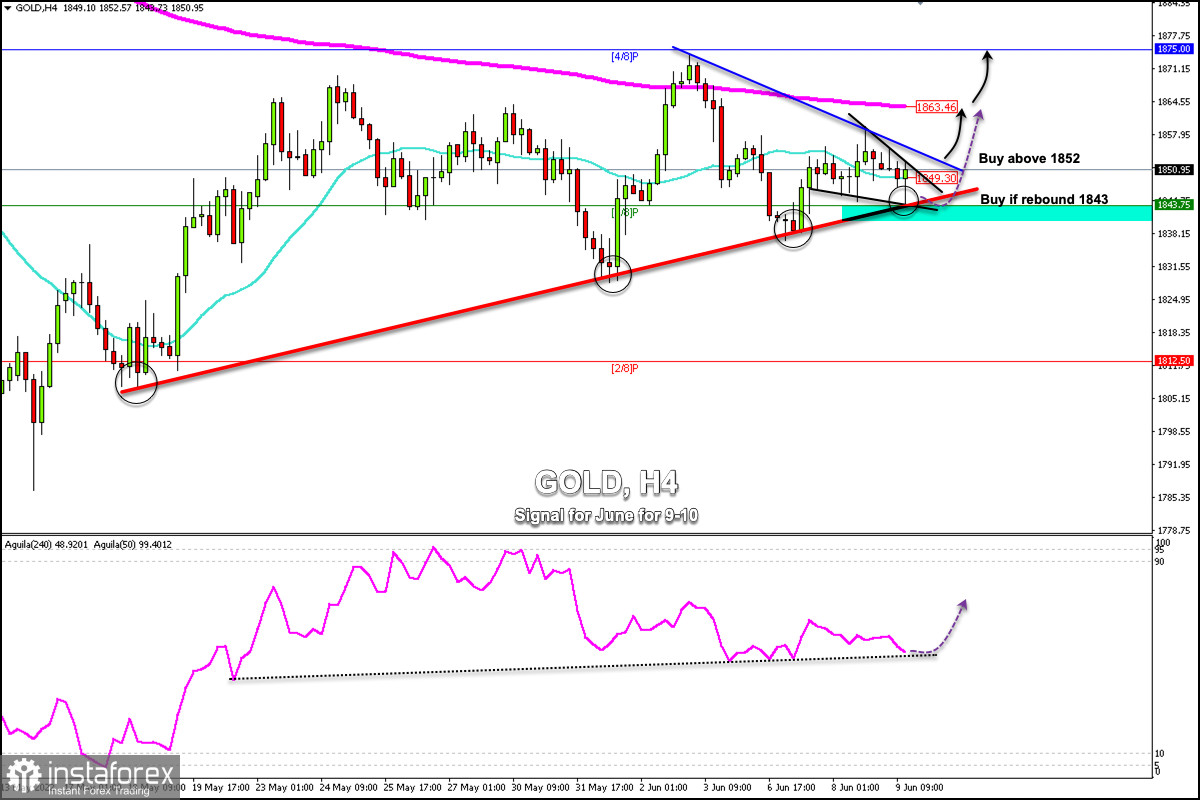
Early in the American session, gold (XAU/USD) was around 1,850. A symmetrical triangle formation is observed. This technical pattern could give a good bullish signal in case gold consolidates above 1,852.
Gold has been testing the uptrend channel since May 13 and has bounced above it on several occasions.
If in the next few hours, if gold remains trading above 1,840-1,843, it is likely to have a positive outlook and could reach the 200 EMA around 1,863 and finally the 4/8 Murray at 1,875.
A daily close below 1,840 could accelerate the bearish move and gold could drop quickly towards 2/8 Murray around 1,812. This will mean that gold has lost its upward potential. In this case we could expect a bearish sequence, which could push the price to the low of 1,786 recorded on May 16.
A confirmation of XAU/USD above 1,863, where the 200 EMA is located, should point to a test of the strong barrier at 1,875 (4/8 Murray).
In the opposite direction, we see strong support at 1,840, which is the 21 SMA on daily charts. Thus, a settlement below this level would leave gold vulnerable to further losses.
At 1,830 there is another key support, which if broken could lead to a drop to 1,812 (2/8 Murray) and even to the psychological level of 1,800.
On Friday, June 10th, the US inflation data could give strong volatility to gold. Next week, the FOMC meeting will take place. A rasie of 0.50% is expected. That is why investors are likely to be cautious in taking aggressive positions and gold is expected to be trading in the range between 1,840 (3/8) - 1,860 (200 EMA).
Our trading plan is to wait for a technical bounce around 1,840-1,843 in order to buy with targets at 1,852 and 1,863. Conversely, a sharp break of the symmetrical triangle and above 1,852 will be a signal to buy with targets at 1,863 and 1,875.
The eagle indicator is giving a neutral signal and gold is likely to consolidate in the coming days.
Le recensioni analitiche di InstaForex ti renderanno pienamente consapevole delle tendenze del mercato! Essendo un cliente InstaForex, ti viene fornito un gran numero di servizi gratuiti per il trading efficiente.


