 Rimani
Condizioni di trading
Strumenti

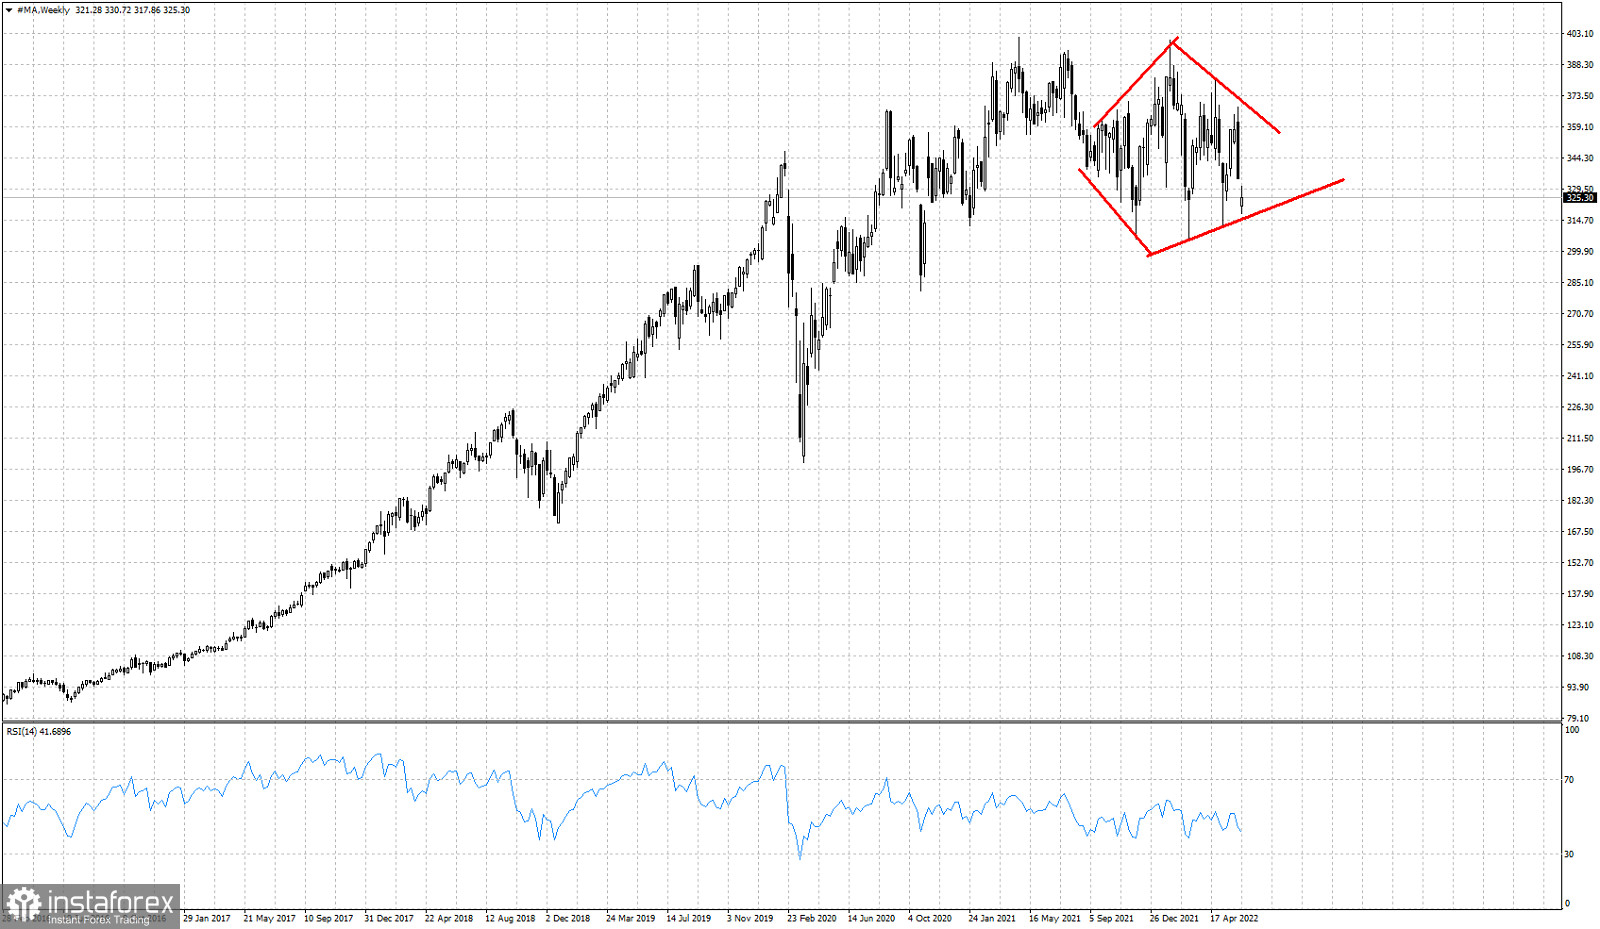
Red lines- diamond pattern boundaries
In the weekly chart of MA stock price we have identified a price pattern that if met near the highs of a trend, usually indicates increased chances of a bearish reversal. In MA weekly price chart we have identified a bearish diamond pattern. Price is now challenging the lower boundary of the pattern. Support is found at $314. There are increased chances, if support is respected, for price to bounce higher towards the upper boundary resistance at $362. Failure to hold above $314, will be a bearish signal and activation of the bearish pattern. Price will then be expected to decline towards $220-$240 area.
Le recensioni analitiche di InstaForex ti renderanno pienamente consapevole delle tendenze del mercato! Essendo un cliente InstaForex, ti viene fornito un gran numero di servizi gratuiti per il trading efficiente.


