 Rimani
Condizioni di trading
Strumenti


Analysis of previous deals:
30M chart of the EUR/USD pair
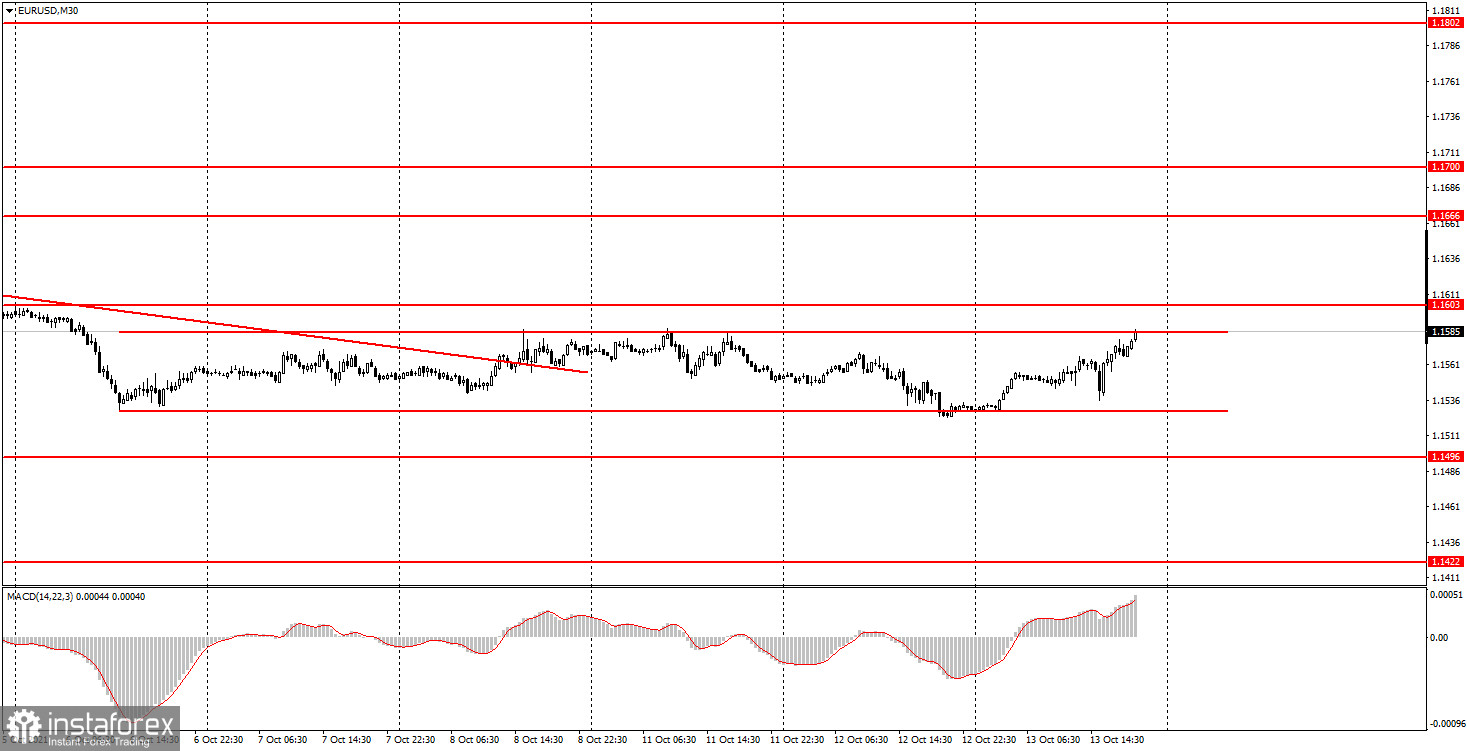
The EUR/USD pair continued to trade in absolute flat on Wednesday. This is clearly seen on the 30-minute timeframe, where there is now a horizontal channel that covers the last six trading days. The width of this channel is 53 points, which is very, very small. Therefore, at this time, both the volatility is low and flat. In general, there is everything that traders do not need. Thus, at the 30-minute TF, we still do not recommend considering signals from the MACD indicator. It just doesn't make any sense. You can try to make a profit even on the smallest timeframe, but even there it is very problematic to do it. There were not a lot of macroeconomic reports available in the European Union and the United States. By and large, it all boiled down to a single report on US inflation. This report has always been considered quite important, and therefore today, when it became known about the acceleration of the consumer price index to 5.4% y/y, the markets reacted with the US dollar strengthening by 20 points. And an hour later, the opposite movement began, which completely neutralized the dollar's entire growth. However, in any case, all these movements took place inside the horizontal channel, and the overall volatility of the day was again about 40 points.
5M chart of the EUR/USD pair
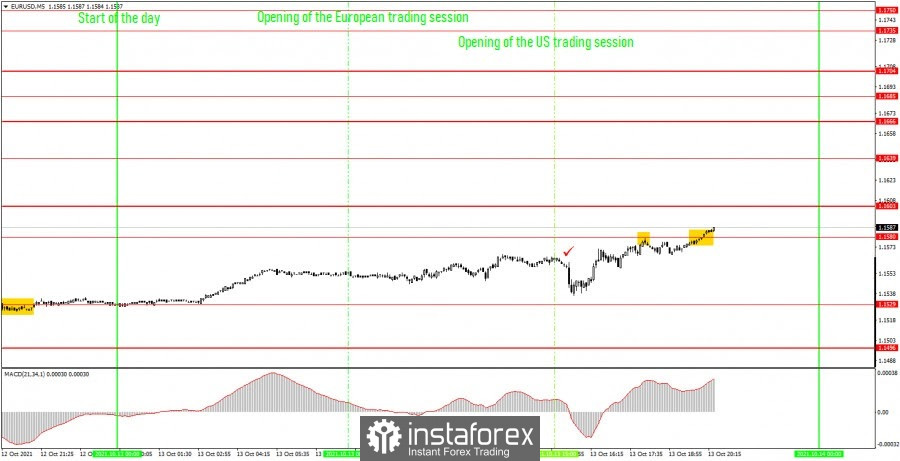
The technical picture looks even more eloquent on the 5-minute timeframe. The pair has been trading between the levels of 1.1529 and 1.1580 throughout the day and only managed to reach the upper level by the end of the day. Thus, two signals were formally formed: one to sell, the other to buy. However, naturally, they should not have been rejected, since they were formed too late. Earlier, not a single trading signal was generated and, probably, this is for the best, since in conditions of an absolute flat, many false signals are often formed. We also draw the attention of novice traders to the tick that marks the time when the US inflation report is published. As you can see, at first the pair went down by about 20 points (dollar growth), and then began a stronger upward movement. Therefore, there was not much sense in the inflation report.
How to trade on Thursday:
The downward trend was cancelled on the 30-minute timeframe, and a flat was formed instead. In most cases, volatility still does not exceed 40-50 points. Thus, it is still very inconvenient to trade on the 30-minute TF, and we still do not recommend tracking signals from the MACD indicator. We recommend you wait for the flat to end. The key levels on the 5-minute timeframe for October 14 are 1.1529, 1.1580, 1.1603, 1.1639. Take Profit, as before, is set at a distance of 30-40 points. Stop Loss - to breakeven when the price passes in the right direction by 15 points. At the 5M TF, the target can be the nearest level if it is not too close or too far away. If it is, then you should act according to the situation or work according to Take Profit. No macroeconomic statistics in the European Union and America on Thursday. We mean important reports or fundamental events. However, now it does not matter at all, because with or without an important "foundation", the pair still passes 40-50 points per day, no more, and it has been in a horizontal channel for the last six days.
On the chart:
Support and Resistance Levels are the Levels that serve as targets when buying or selling the pair. You can place Take Profit near these levels.
Red lines are the channels or trend lines that display the current trend and show in which direction it is better to trade now.
The MACD indicator (14,22,3) consists of a histogram and a signal line. When they cross, this is a signal to enter the market. It is recommended to use this indicator in combination with trend lines (channels and trend lines).
Important speeches and reports (always contained in the news calendar) can greatly influence the movement of a currency pair. Therefore, during their exit, it is recommended to trade as carefully as possible or exit the market in order to avoid a sharp price reversal against the previous movement.
Beginners on Forex should remember that not every single trade has to be profitable. The development of a clear strategy and money management are the key to success in trading over a long period of time.
Le recensioni analitiche di InstaForex ti renderanno pienamente consapevole delle tendenze del mercato! Essendo un cliente InstaForex, ti viene fornito un gran numero di servizi gratuiti per il trading efficiente.

