 Rimani
Condizioni di trading
Strumenti


Here are the details of the economic calendar for October 27:
Yesterday, durable goods data were published, where their volume decreased by -0.4% in the period of September. This is not the best result, but an even stronger reduction of -1.1% was expected. As a result, the US dollar was still under pressure.
Analysis of trading charts from October 27:
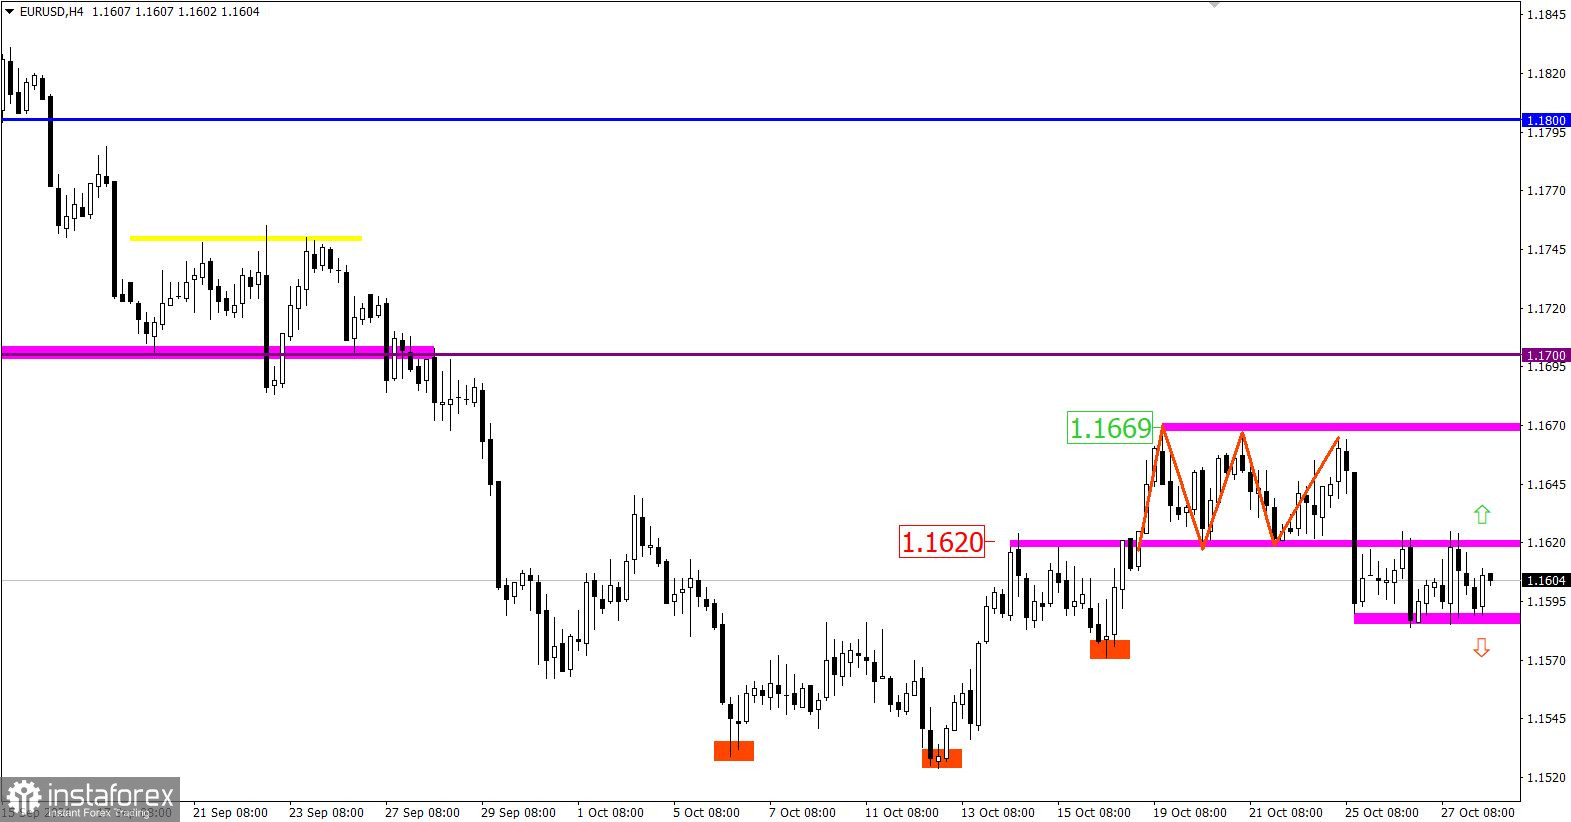
The EUR/USD pair formed a side-channel again in the range of 1.1585/1.1625 after a short decline. It is assumed that the stagnation is associated with the upcoming ECB meeting, which leads to the accumulation of trade forces. As a result, there will be an outgoing impulse with a sharp increase in speculative interest.
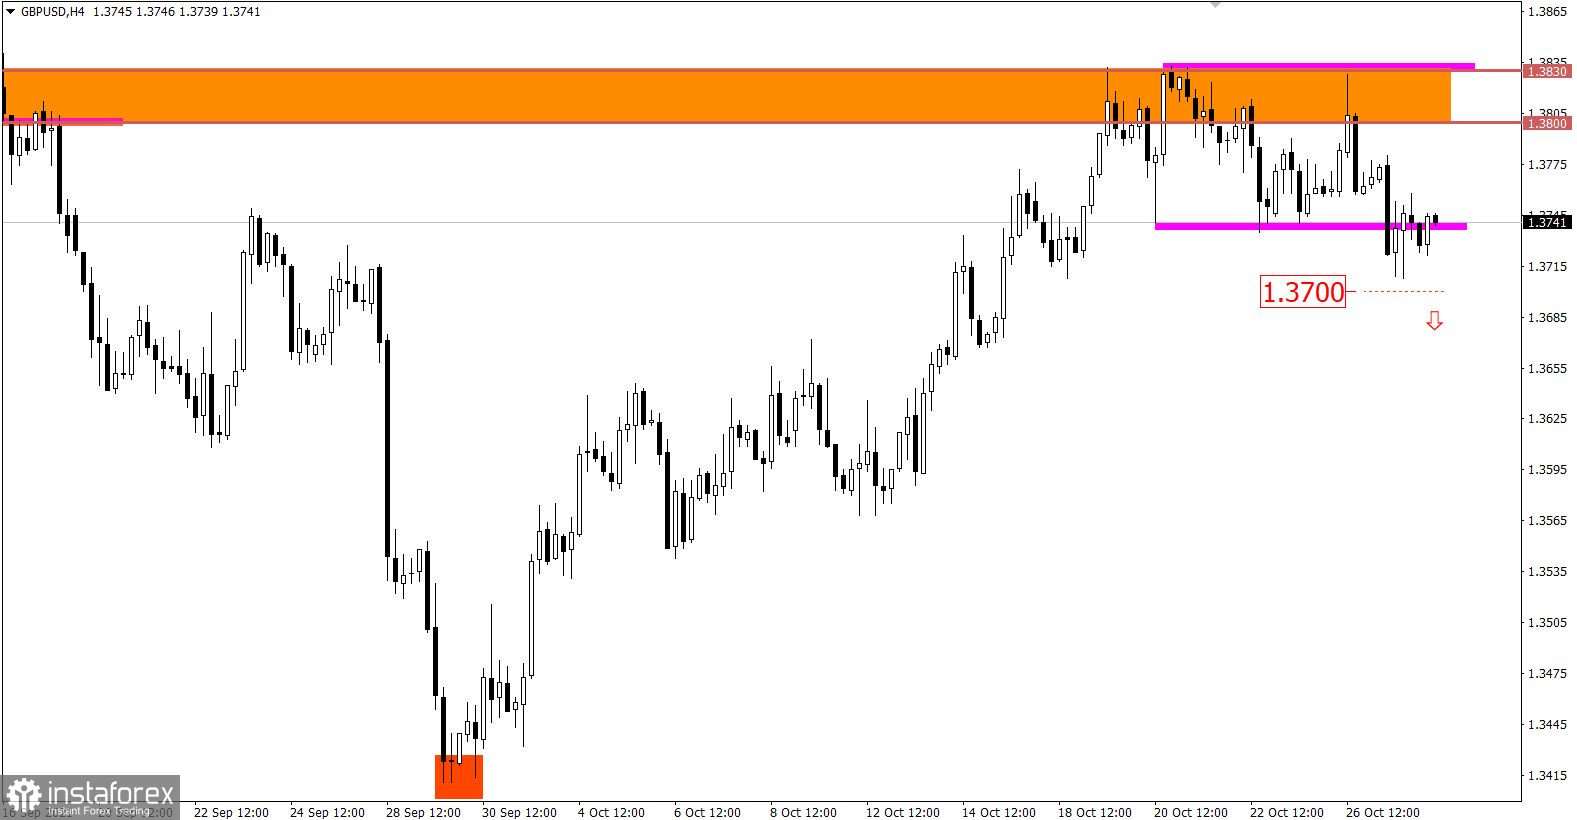
The GBP/USD pair consistently restores the dollar exchange rate relative to the correction from the support point of 1.3400. The resistance is the 1.3800/1.3830 area, where there was a change of trading interests, which led to a gradual decline.
In fact, we are still at the peak of the correction, but at the same time, the first signal to sell the pound sterling already appeared.

October 28 economic calendar:
The focus today is the European Central Bank's meeting. Market participants are waiting for new information on the prospects for monetary policy in the euro area.
There is no doubt that the parameters of the ECB's monetary policy will remain unchanged, but this does not mean that the situation in the currency market will not change in any way. If Christine Lagarde announces the timing and extent of monetary policy tightening during her press conference, as the Fed and the Bank of England did earlier, then the euro will receive a strong incentive to grow. But if the ECB does not say anything again, then the suspended upward trend of the US dollar will resume.
The results of the ECB meeting - 11:45 Universal time
Press conference - 12:30 Universal time
Trading plan for EUR/USD on October 28:
Today, the side channel in the range of 1.1585/1.1625 is highly likely to end. Trading tactics consider the method of breaking one or another border of the set range.
Trading plan for GBP/USD on October 28:
Here, special attention is paid to the price area of 1.3700/1.3720, since keeping the price below will lead to an increase in the volume of short positions. This will open the way towards the level of 1.3610.
Otherwise, the lateral amplitude along the resistance area will remain in the market.
What is reflected in the trading charts?
A candlestick chart view is graphical rectangles of white and black light, with sticks on top and bottom. When analyzing each candle in detail, you will see its characteristics of a relative period: the opening price, closing price, and maximum and minimum prices.
Horizontal levels are price coordinates, relative to which a stop or a price reversal may occur. These levels are called support and resistance in the market.
Circles and rectangles are highlighted examples where the price of the story unfolded. This color selection indicates horizontal lines that may put pressure on the quote in the future.
The up/down arrows are the reference points of the possible price direction in the future.
Le recensioni analitiche di InstaForex ti renderanno pienamente consapevole delle tendenze del mercato! Essendo un cliente InstaForex, ti viene fornito un gran numero di servizi gratuiti per il trading efficiente.


