 Rimani
Condizioni di trading
Strumenti


Bitcoin kicks off a new trading week with a successful recovery above the $60,200-$65,500 area, bringing the moment of full-fledged movement closer to new highs. However, in order to determine the probable moment of the beginning of a full-fledged upward movement, it is necessary to analyze the horizontal charts and determine the key lines within which the bitcoin price moves along the course of the current bull market.
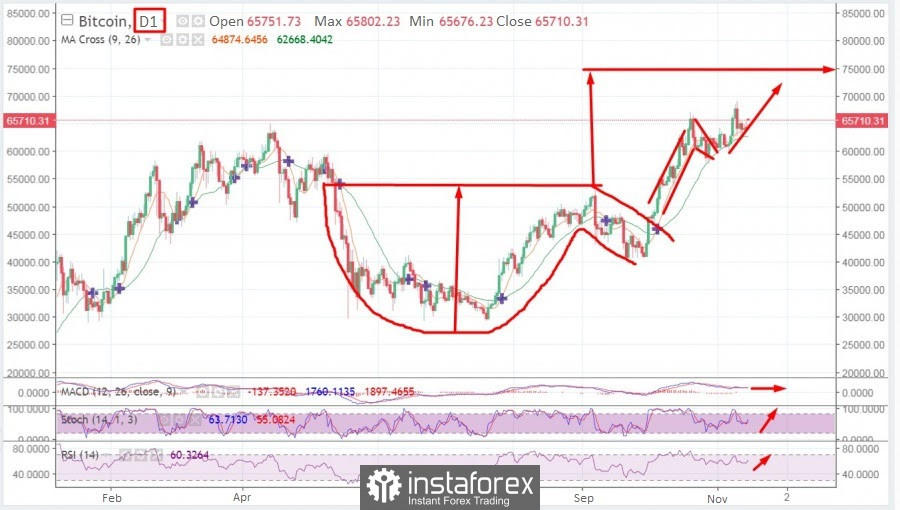
Let's start with the fundamental picture of Bitcoin to find key resistance and support levels, as well as determine the potential for cryptocurrency movement in the final fifth wave of growth. First of all, it should be noted that on the daily BTC chart, the positive sentiment of investors remains and clear signals for the continuation of the upward movement are visible.
The endpoint for the rally is the $75,000 mark, where it is worth fixing a part of the profit, even despite the subsequent movement upside. In the period from June 2021, a "cup and handle" technical analysis pattern began to form on the daily Bitcoin chart, which is a bullish long-term formation indicating an upward trend is approaching.
The potential for price movement is equal to the final levels that form the pattern, that is, the $75,000 area. Further, a subsequent bullish formation in the form of a "pennant" was formed on the charts, which also indicates the preservation and strengthening of the upward movement, which is evident from the further price movement.
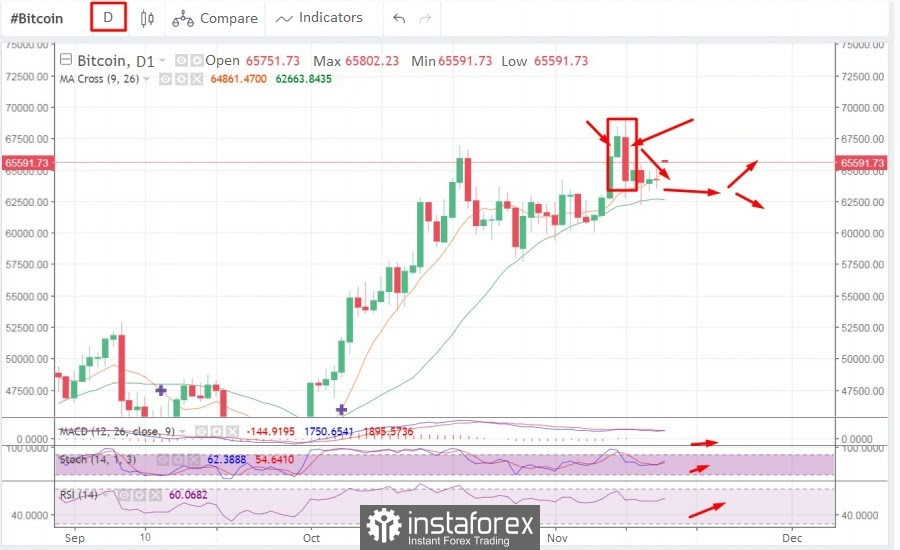
Looking at the daily chart more locally, a bearish engulfing pattern can be seen over the past few days followed by a wave of uncertainty. First of all, it should be noted that the emergence of the pattern is directly related to the buyers' attempt to overcome the resistance zone at $65.900.
As a result, the bulls managed to break through this line and form another bullish candle of lesser strength, where the growing pressure of sellers was already felt, judging by the upper shadow. Sellers then managed to seize the initiative and form a confident bearish candlestick, which summed up a false breakout of the $65,900 support zone.
Subsequently, the price continued to fluctuate in the final narrow range of $65,600- $67,700, the exit from which will be the beginning of the movement to new highs. Technical indicators on the daily chart signal a gradual increase in the strength of an upward rend, and therefore an exit from the range may occur today.
*Learn and analyze
Price consolidation is the period when a certain cryptocurrency is within a narrow horizontal price channel. Usually, this process indicates price stabilization or weakness of market participants (buyers and sellers).
Relative Strength Index (RSI) is a technical indicator that allows you to determine the strength of a trend (downward or upward), warns of possible changes in the direction of price movement. Thanks to this metric, it is possible to determine in what stage the asset is - overbought or underbought. The optimal mark for this chart is 60 for a bullish trend. It indicates strong demand for the coin and the strength of the current upward momentum. Upon crossing this mark, the coin begins to move towards overbought.
MACD (Moving Average Convergence / Divergence Index) is an indicator that allows you to draw certain conclusions about the trend based on the movement of the moving averages and find the metric values between them. A common bullish signal is the intersection of the white line below the red and bearish, on the contrary, when the white line crosses the red from above, which indicates a downward movement.
Stochastic (Stochastic Oscillator) - the indicator indicates the strength of the momentum of the current prevailing trend. If the indicator is above 80, then the asset can be considered overbought, but if the stochastic is below 20, then this is a signal that the asset is oversold.
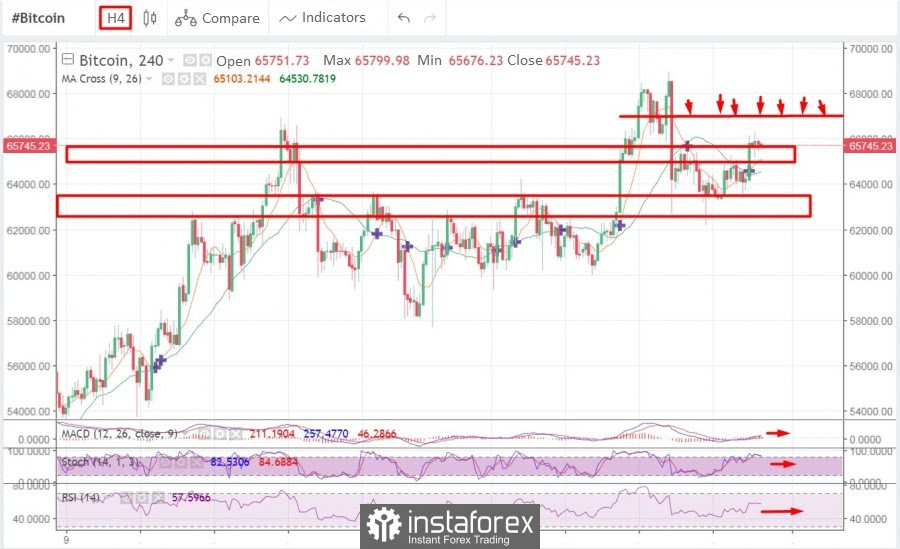
On the 4-hour timeframe, the price is stuck at the resistance level of $65,700. At the same time, the positions of bulls and bears are approximately equal, and technical indicators indicate a sideways movement, which also indicates a period of consolidation and a lack of initiative from market participants.
Despite this, MACD is encouraging and leaves the red zone, crossing the zero line. Stochastic is in the overbought zone and is forming a bearish crossover, which is a signal for a decline in price due to the weakening of the short-term momentum. It is likely that soon the quotes will cross the problem area and start moving towards the final resistance zone at $66,600. The current price decline should be viewed as a period of stabilization after an impulse rise to $66,000.
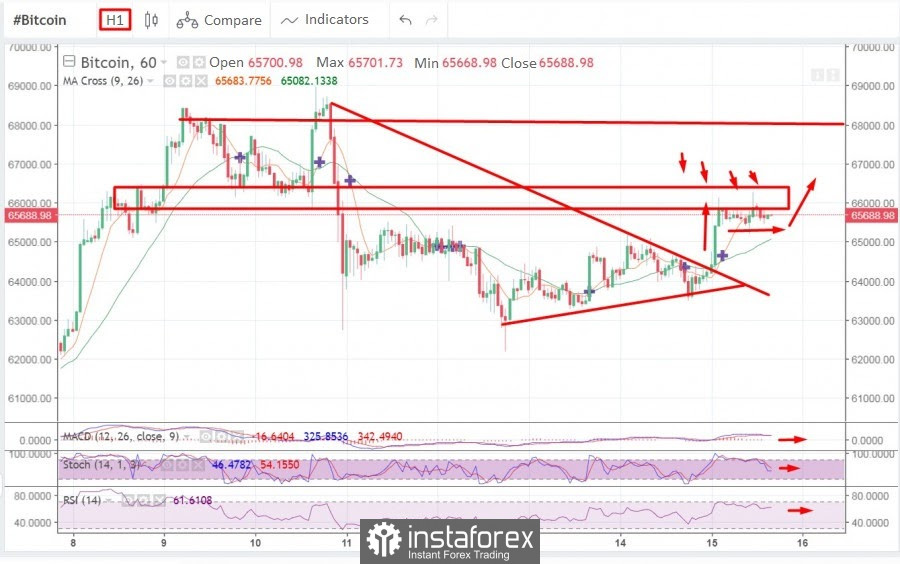
The hourly timeframe demonstrates that as part of a short-term upward trend, Bitcoin managed to overcome an important resistance level and complete a bullish wedge retraction on November 11. This is a clear bullish signal, followed by the price to the next range around $66,000. BTC quotes bounced off this zone and are unlikely to be able to overcome it in the near future.
Technical indicators confirm this: MACD is still weak and moving flat, while the Stochastic Oscillator and Relative Strength Index have just begun to recover, and are also moving sideways. Despite this, with a successful exit and consolidation above the $66,000 area, bitcoin will move to a historical record, where the strength of buyers will not leave this resistance zone even a chance.
In general, the situation with Bitcoin remains bullish and on Monday, November 15, the asset has taken an important step towards a bullish rally, which will take place this week. Taking into account the analysis of all the formations on the cryptocurrency charts, a new bullish rally will begin within the next two days, where the final target will be the area of $75,000.
Le recensioni analitiche di InstaForex ti renderanno pienamente consapevole delle tendenze del mercato! Essendo un cliente InstaForex, ti viene fornito un gran numero di servizi gratuiti per il trading efficiente.

