 Rimani
Condizioni di trading
Strumenti


Yesterday, Britain's inflation data was published, where the level of consumer prices rose from 3.1% to 4.2% with a forecast of 3.7%. Such a significant increase in inflation is not the best signal for investors, as it entails a tightening of monetary policy.
In this case, traders' speculative mood played a role. The value of the pound locally increased.
After that, Europe reported inflation data, where its level coincided with a preliminary estimate of 4.1%. Since the data has already been considered in the quote, market participants did not react to them in any way.
During the US trading session, America's data on the construction sector were published, where the number of construction permits issued in October surged by 4%. At the same time, the volume of construction of new homes slightly fell by 0.7%.
As a result, the market met the statistics positively with a local strengthening of US dollar positions.
Analysis of trading charts from November 17:
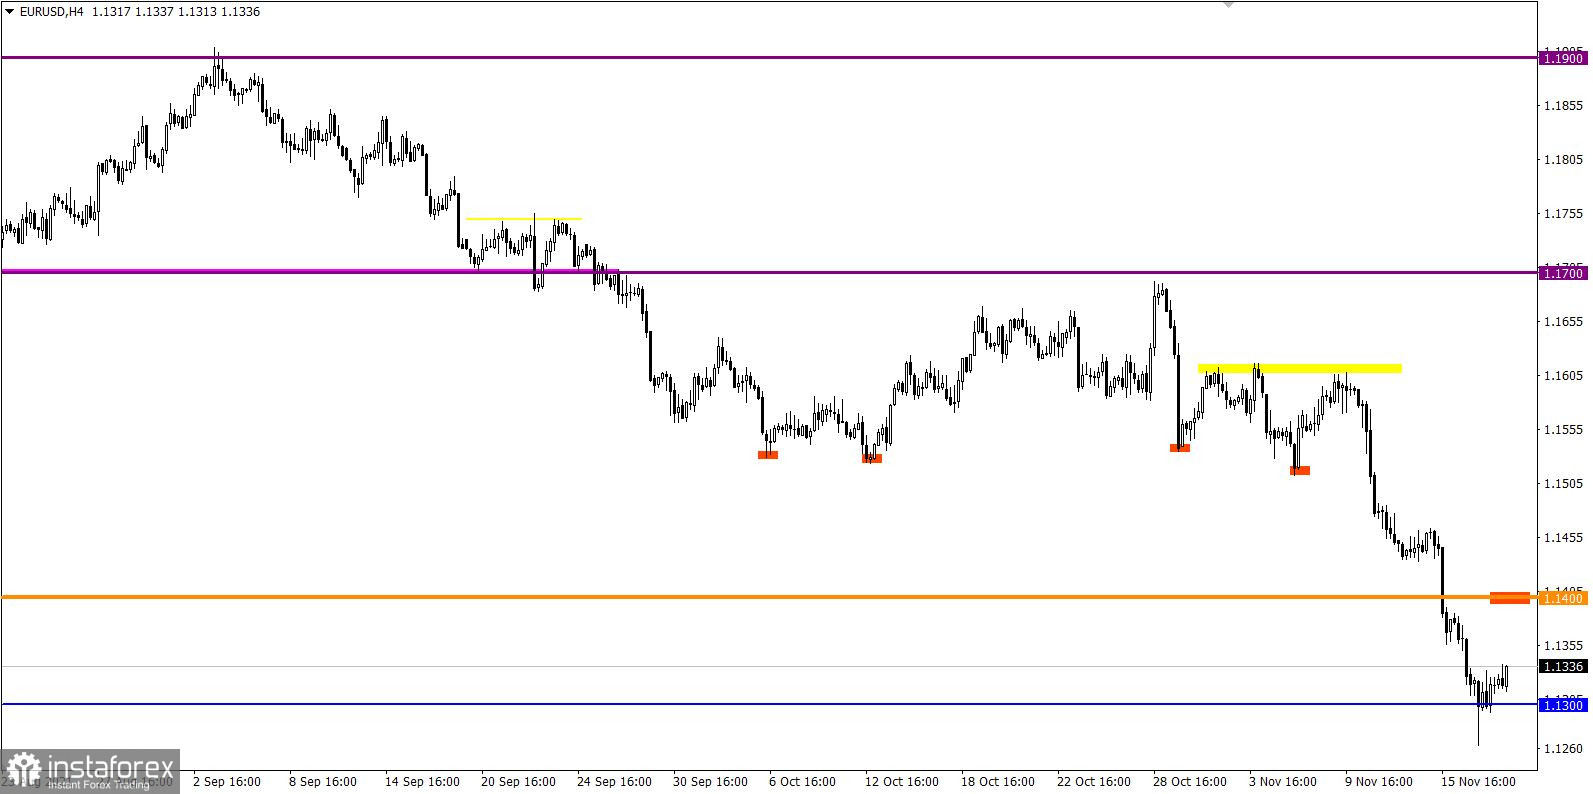
The European currency found a variable pivot point of 1.1263 during a sharp decline, relative to which a technical pullback occurred. The oversold stage of the euro is very noticeable, which can positively affect the volume of long positions.
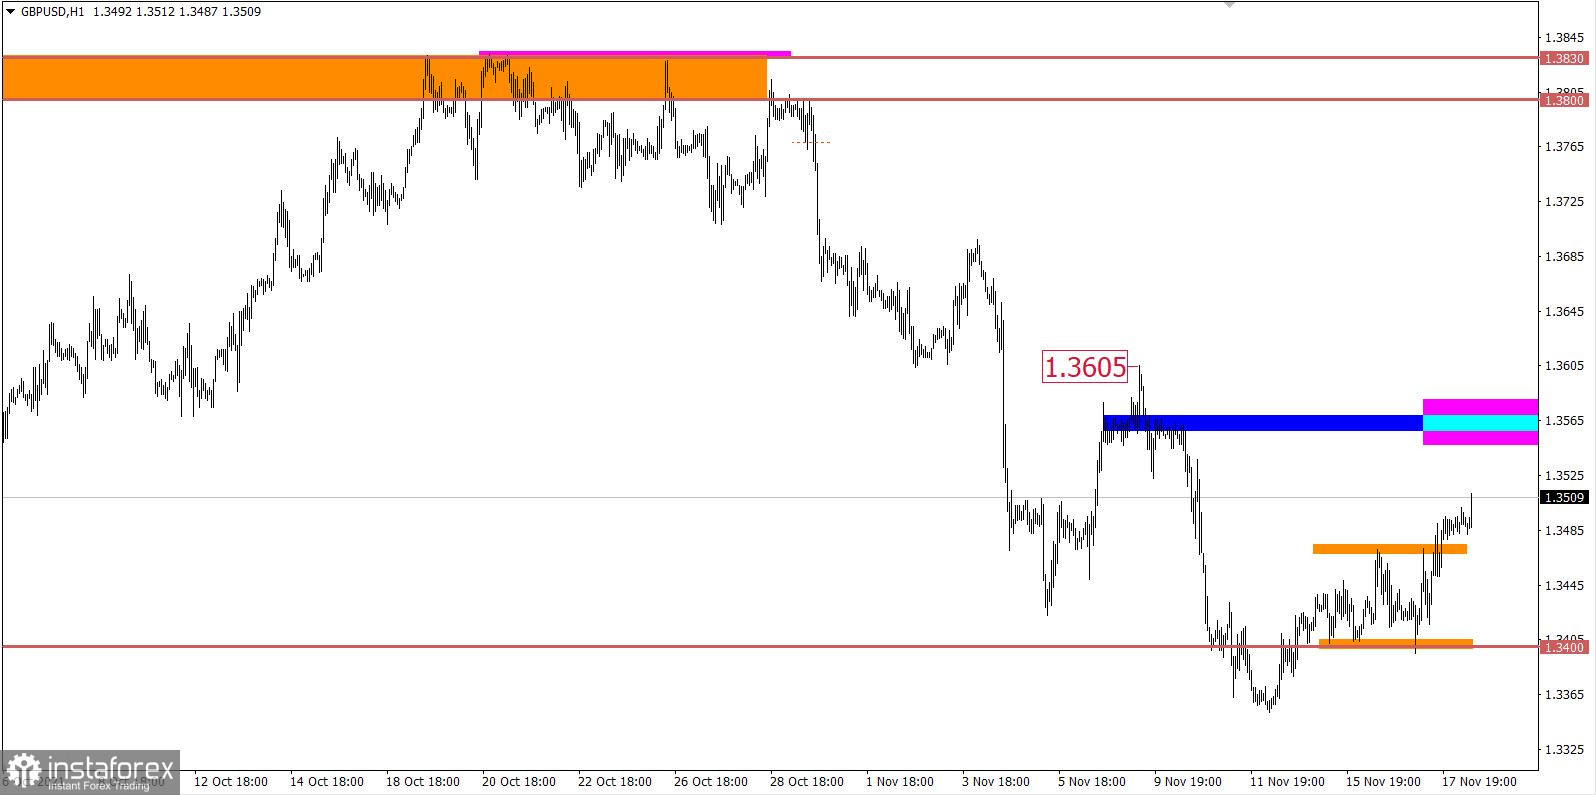
The GBP/USD pair resumed its correction course after a 60-hour stop. As a result, the upper limit was broken, and the quote rushed above the level of 1.3500.

November 18 economic calendar:
The US weekly data on applications for unemployment benefits will be published today, where they predict a reduction in their volume.
Details of statistics:
The volume of initial applications for benefits may fall from 267 thousand to 260 thousand.
The volume of repeated applications for benefits may fall from 2,160 thousand to 2,120 thousand.
* Applications for unemployment benefits reflect the number of currently unemployed citizens and those receiving unemployment benefits. This indicator is considered to be the state of the labor market, where the growth of the indicator negatively affects the level of consumption and economic growth. The reduction of applications for benefits has a positive effect on the labor market.
Trading plan for EUR/USD on November 18:
The variable resistance level is 1.1340, relative to which stagnation has occurred. The pullback stage may change to a correction in the direction of the level of 1.1400. At the same time, there is a speculative rush to short positions. Therefore, if the price is kept below the level of 1.1290, it is not necessary to exclude the continuation of the downward cycle.
The stagnation during the Asian session became a kind of accumulation of trading forces, which resulted in a strengthened corrective course. Now, the level of 1.3570 stands in the way of buyers, in the area in which it is possible to reduce the volume of long positions. This will lead to a stop of the correction and a possible price reversal.
A candlestick chart view is graphical rectangles of white and black light, with sticks on top and bottom. When analyzing each candle in detail, you will see its characteristics of a relative period: the opening price, closing price, and maximum and minimum prices.
Horizontal levels are price coordinates, relative to which a stop or a price reversal may occur. These levels are called support and resistance in the market.
Circles and rectangles are highlighted examples where the price of the story unfolded. This color selection indicates horizontal lines that may put pressure on the quote in the future.
The up/down arrows are the reference points of the possible price direction in the future.
Le recensioni analitiche di InstaForex ti renderanno pienamente consapevole delle tendenze del mercato! Essendo un cliente InstaForex, ti viene fornito un gran numero di servizi gratuiti per il trading efficiente.


