 Rimani
Condizioni di trading
Strumenti


Here are the details of the economic calendar for November 26, 2021:
Last Friday, Europe and the UK had a completely empty macroeconomic calendar, and the United States had an early close to celebrate Thanksgiving.
Analysis of trading charts from November 26:
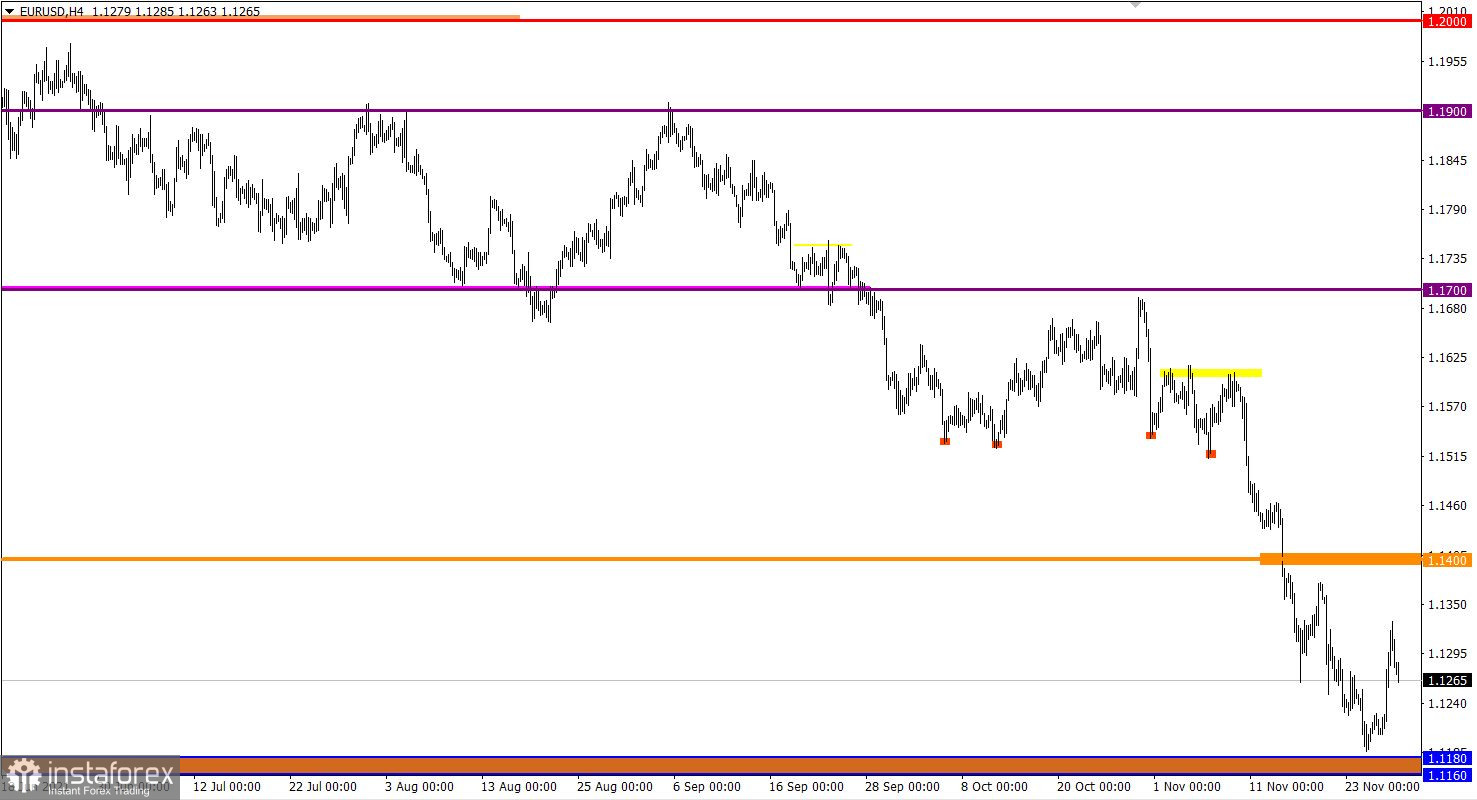
The EUR/USD pair slowed down its downward movement after the price converged with the support area of 1.1160/1.1180. This led to a technical correction in the market, which was indicated by the euro's high oversold status.
In the previous analytical review, a correction scenario was considered if traders still fail to break through the 1.1160/1.1180 support area. Thus, it was possible to enter into positions to buy the oversold euro.
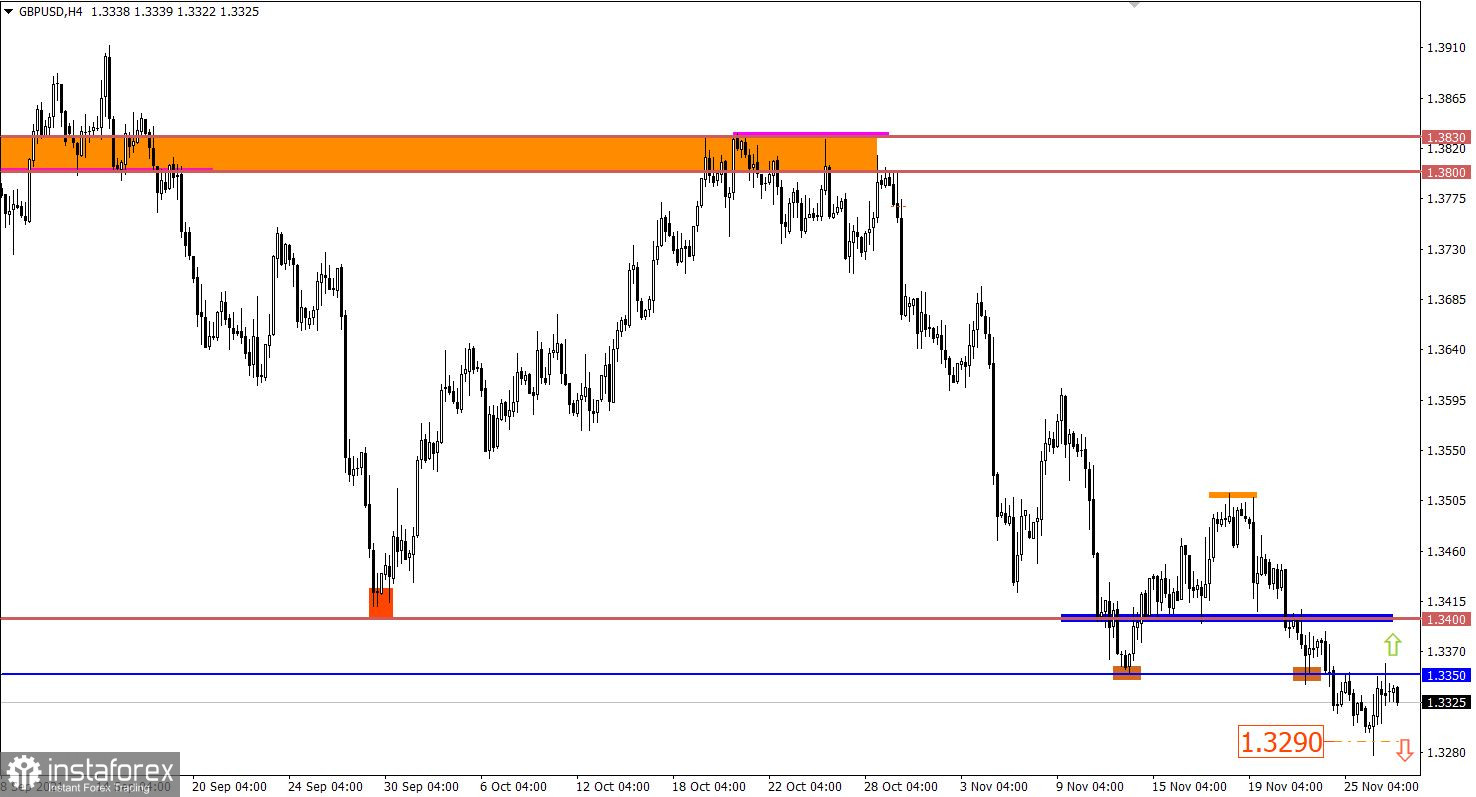
The GBP/USD pair pulled back once again to the previously broken level of 1.3350, winning it back as resistance. Market activity is quite low, which indicates stagnation. This may well become a lever for speculators in the upcoming acceleration in the market.
The trading plan for November 26 considered GBP to fall if the price is locked below 1.3290 on the 4-hour chart. Instead, the candlestick's wick pierced 1.2390 and then the price returned to the upside.

The UK's lending market data will be published today at 9:30 Universal time. Here, the volume of consumer lending is expected to fall by 0.6 billion pounds, while it is expected that only 70.1 thousand mortgage loans will be approved against 72.6 thousand in the previous month.
At the same time, the volume of mortgage lending will amount to only 4.8 billion pounds, although a month ago it was equal to 9.5 billion pounds. In general, the forecasts are rather pessimistic, which means that the pound is likely to be under pressure.
Trading plan for EUR/USD on November 29:
It is quite possible that the correction is almost over, which will lead to the restoration of the volume of short positions. The support area of 1.1160/1.1180 is considered as the main pivot point again. Repeated convergence of the price may increase the chance of its breakdown.
The maximum deviation of the correction course is possible to the resistance level of 1.1400.
It can be assumed that the downward scenario is still relevant among traders, but in order for the signal to sell the pound sterling to be confirmed, the quote needs to stay below the level of 1.3290 in a four-hour period. This will open the way towards the level of 1.3150.
Traders will consider an alternative scenario if the price is kept above the level of 1.3360. This will lead to a technical correction.
A candlestick chart view is graphical rectangles of white and black light, with sticks on top and bottom. When analyzing each candle in detail, you will see its characteristics of a relative period: the opening price, closing price, and maximum and minimum prices.
Horizontal levels are price coordinates, relative to which a stop or a price reversal may occur. These levels are called support and resistance in the market.
Circles and rectangles are highlighted examples where the price of the story unfolded. This color selection indicates horizontal lines that may put pressure on the quote in the future.
The up/down arrows are the reference points of the possible price direction in the future.
Le recensioni analitiche di InstaForex ti renderanno pienamente consapevole delle tendenze del mercato! Essendo un cliente InstaForex, ti viene fornito un gran numero di servizi gratuiti per il trading efficiente.

