 Rimani
Condizioni di trading
Strumenti


BTC/USD is analyzed on the hourly chart.
BTC/USD, H1:
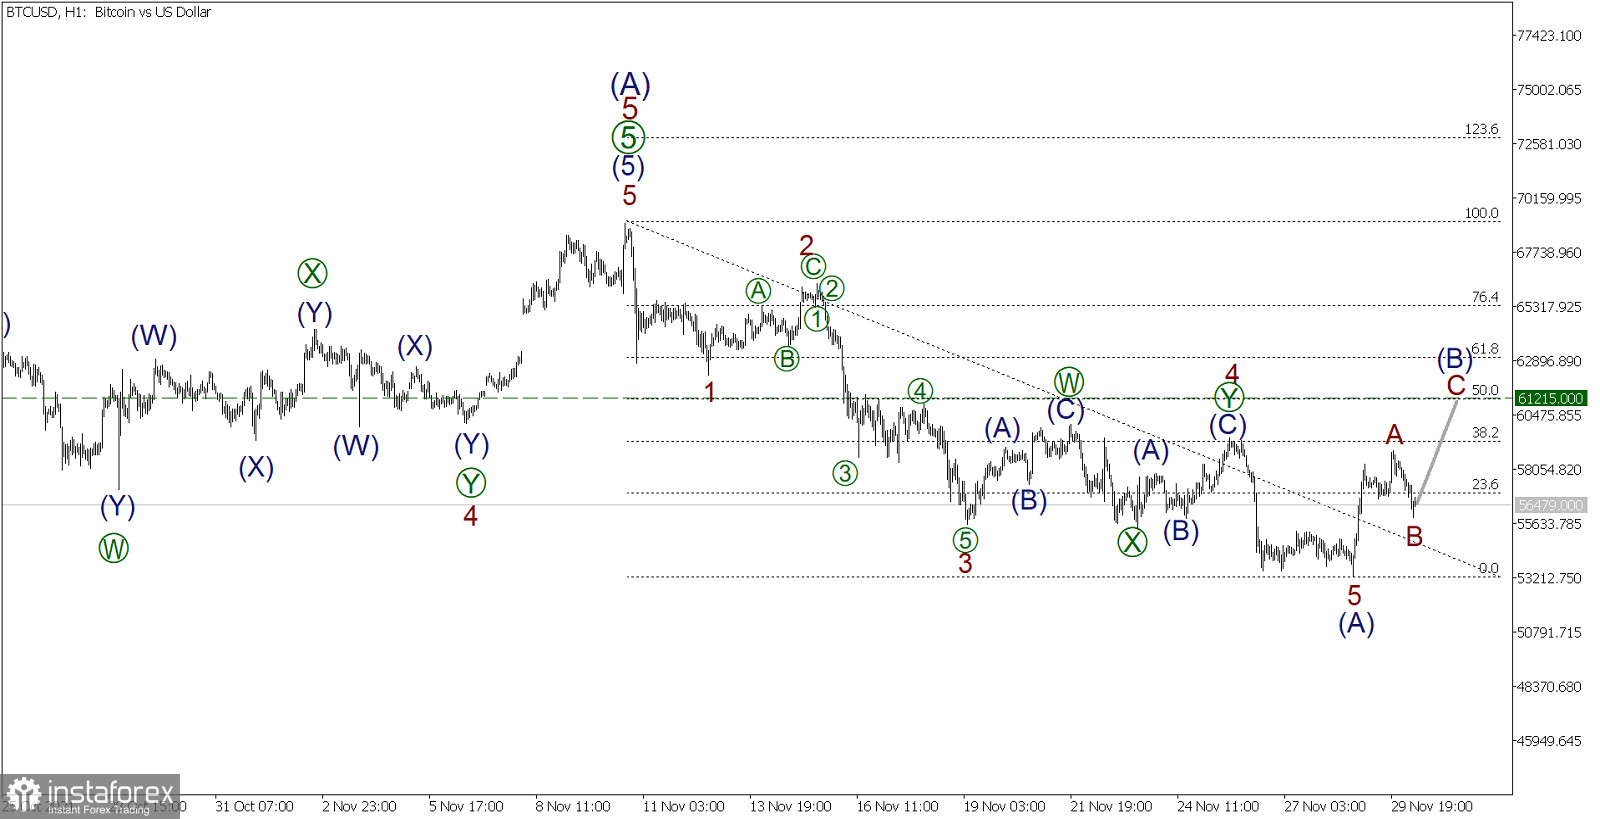
According to the H1 chart, the downward zigzag pattern is currently forming. The bearish wave A in its structure has already been completed. It has the shape of a five-wave impulse and consists of 5 sub-waves.
So, the last ascending wave indicates a bullish correction (B). It is assumed to be in the shape of a simple zigzag (A-B-C). At this point, an impulse wave (A) and a corrective wave (B) could have been completed. Accordingly, wave C may head upwards soon. It may turn into an impulse wave or have a shape of a finite diagonal.
Wave C could end at around 61215.00. At this level, there will be a 50% correction (B) from the bearish wave (A). There is a high likelihood that this mark will be reached.
Long positions could be opened as soon as a correction (B) ends.
Trading recommendations: a Take-profit order could be set at 61215.00. Long positions could be opened from the current level.
Le recensioni analitiche di InstaForex ti renderanno pienamente consapevole delle tendenze del mercato! Essendo un cliente InstaForex, ti viene fornito un gran numero di servizi gratuiti per il trading efficiente.

