 Rimani
Condizioni di trading
Strumenti

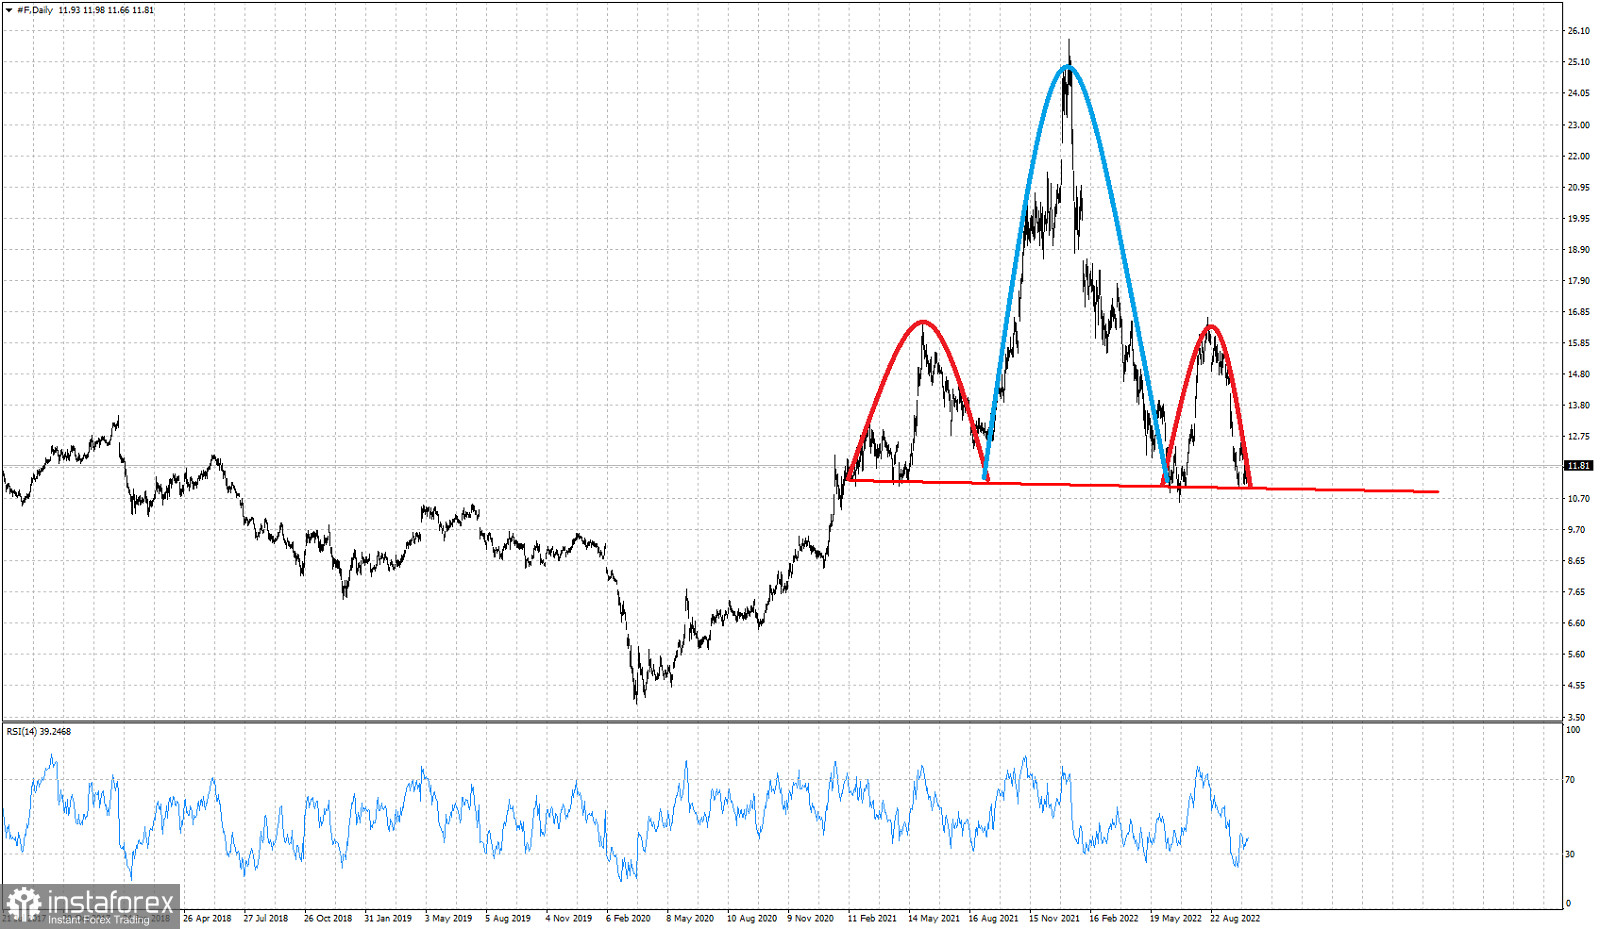
Red line- neckline support
Blue line- Head
Red curved lines- Shoulders
Ford stock price is at $11.81 after a multi month decline from $25.85. This is not the first time price has reached the $12-$11 zone. Price was here in June-July, then a bounce towards $16.70 followed. Zooming out we observe a multiweek head and shoulders pattern with price challenging the neckline support. Price is now at very important support and the RSI turning upwards from oversold levels. Despite being a bearish pattern, it can also be used by bulls. Opening long positions with stops at the neckline support would be a strategy used by aggressive traders. The right hand shoulder high at $16.67 if broken, it will cancel the bearish scenario of the Head and shoulders pattern. A weekly break below $11 would be a bearish sign.
Le recensioni analitiche di InstaForex ti renderanno pienamente consapevole delle tendenze del mercato! Essendo un cliente InstaForex, ti viene fornito un gran numero di servizi gratuiti per il trading efficiente.


