 Rimani
Condizioni di trading
Strumenti


GBP/USD 5M
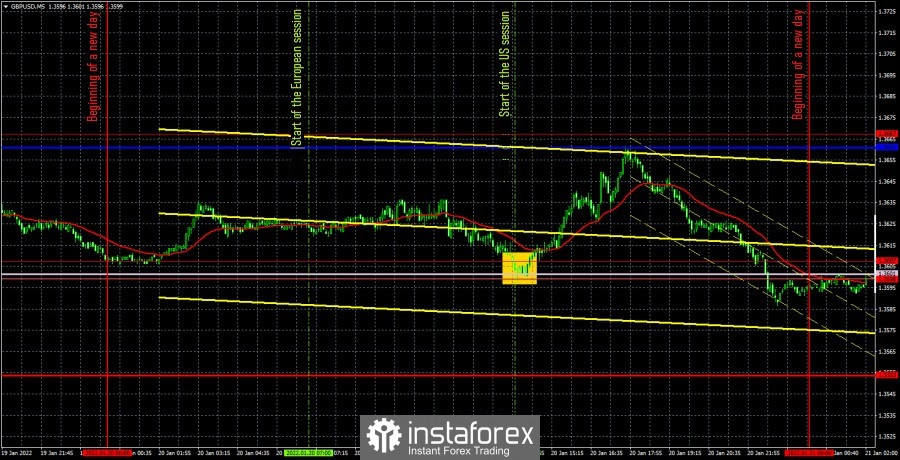
The GBP/USD pair also traded differently during the day on Thursday. The pound's quotes fell in the first half of the day, and rose in the second half. Moreover, the movements on the pound/dollar pair were less "ragged" than on the euro/ dollar pair. That is, it was a positive for traders. There were no macroeconomic statistics in the UK yesterday. Traders still do not show much interest in it, however, from time to time they react to individual reports. Yesterday, for example, there was a slight reaction to the report on applications for unemployment benefits in the United States, although we did not really count on it. However, the report turned out to be significantly weaker than forecasts, so the dollar slightly fell during the US trading session. However, the overall volatility of the day remained rather weak. Therefore, it was quite difficult to count on a high profit. The markets still ignore all the non-economic information that comes from Great Britain, and there is not so much economic information now. Only one trading signal was formed yesterday, but, as in the euro's case, it turned out to be quite strong. The price bounced at the junction of the European and US sessions from the Senkou Span B line and the area of 1.3598-1.3607. This buy signal should have been worked out, since it was not ambiguous. After its formation, the pair went in the same direction about 50 points and this is the profit that traders could get on it. In principle, this is a very good result with low volatility and a high probability of a flat during the day.
We recommend to familiarize yourself with:
Overview of the EUR/USD pair. January 21. Large banks are waiting for active action from the Fed.
Overview of the GBP/USD pair. January 21. All coronavirus restrictions are being lifted in the UK.
Forecast and trading signals for GBP/USD on January 21. Detailed analysis of the movement of the pair and trading transactions.
COT report
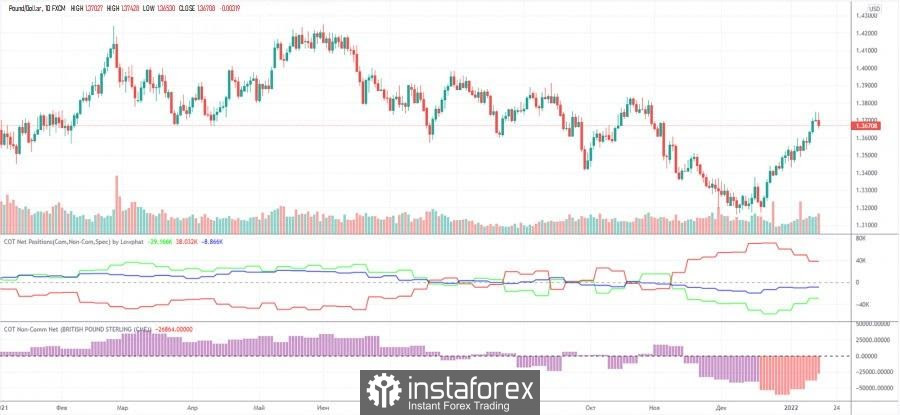
Recall the situation with Commitment of Traders (COT) reports on the euro currency. The picture with the British pound is exactly the opposite. Here, the green and red lines (indicating the net positions of non-commercial and commercial traders) have moved away from each other a couple of weeks ago, which is a signal of the possible end of the trend. That's exactly what happened. At the moment, these lines are converging, so we believe that the upward momentum of the British pound has not been exhausted. The mood of professional traders remains bearish, but at the same time, the trend should be taken into account here. And the trend now is to reduce the difference between the two categories of players. In other words, the bearish mood is weakening. Thus, we believe that after a slight pullback downwards, the growth of the British currency will resume.
GBP/USD 1H
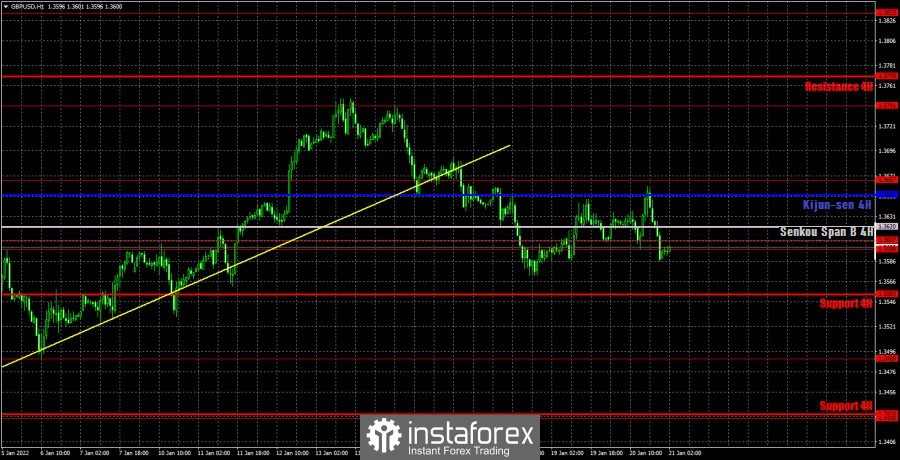
The pound/dollar pair got out of the upward trend on the hourly timeframe, but so far traders do not see any new reasons to buy the dollar and sell the pound. Most likely, this is only a temporary pause, after which short positions will resume after all. The British currency has been rising almost continuously for a month, so the probability of a correction remains high. On the hourly TF, we are now observing an incorrect location of the Senkou Span B and Kijun-sen lines. This is dictated by the fact that the lines often change their position. On the 4-hour TF, the picture of the current state of things is better visible. The pair is located inside the Ichimoku cloud, which means it's too early to talk about a downward trend. It will be possible to talk about it no earlier than crossing the Senkou Span B line. We highlight the following important levels on January 21: 1.3489, 1.3598-1.3607, 1.3667, 1.3741. The Senkou Span B (1.3620) and Kijun-sen (1.3652) lines can also be signal sources. Signals can be "bounces" and "breakthroughs" of these levels and lines. It is recommended to set the Stop Loss level to breakeven when the price passes in the right direction by 20 points. The lines of the Ichimoku indicator can move during the day, which should be taken into account when determining trading signals. A relatively important retail sales report is set to be released in the UK on Friday. Of course, as always, everything will depend on how much the actual value will not correspond to the forecast. If the difference is small, then there is no point in counting on the reaction of traders. There are no other important macroeconomic events planned for today.
Explanations for the chart:
Support and Resistance Levels are the levels that serve as targets when buying or selling the pair. You can place Take Profit near these levels.
Kijun-sen and Senkou Span B lines are lines of the Ichimoku indicator transferred to the hourly timeframe from the 4-hour one.
Support and resistance areas are areas from which the price has repeatedly rebounded off.
Yellow lines are trend lines, trend channels and any other technical patterns.
Indicator 1 on the COT charts is the size of the net position of each category of traders.
Indicator 2 on the COT charts is the size of the net position for the non-commercial group.
Le recensioni analitiche di InstaForex ti renderanno pienamente consapevole delle tendenze del mercato! Essendo un cliente InstaForex, ti viene fornito un gran numero di servizi gratuiti per il trading efficiente.

