 Rimani
Condizioni di trading
Strumenti


The EUR/USD pair dropped sharply from the level of 1.0713 towards 1.0650. Now, the price is set at 1.0658. On the M1 chart, the resistance of EUR/USD pair is seen at the level of 1.0713 and 1.0682. It should be noted that volatility is very high for that the EUR/USD pair is still moving between 1.0682 and 1.0643 in coming hours. Moreover, the price spot of 1.0682/1.0713 remains a significant resistance zone. Therefore, there is a possibility that the EUR/USD pair will move downside and the structure of a fall does not look corrective.
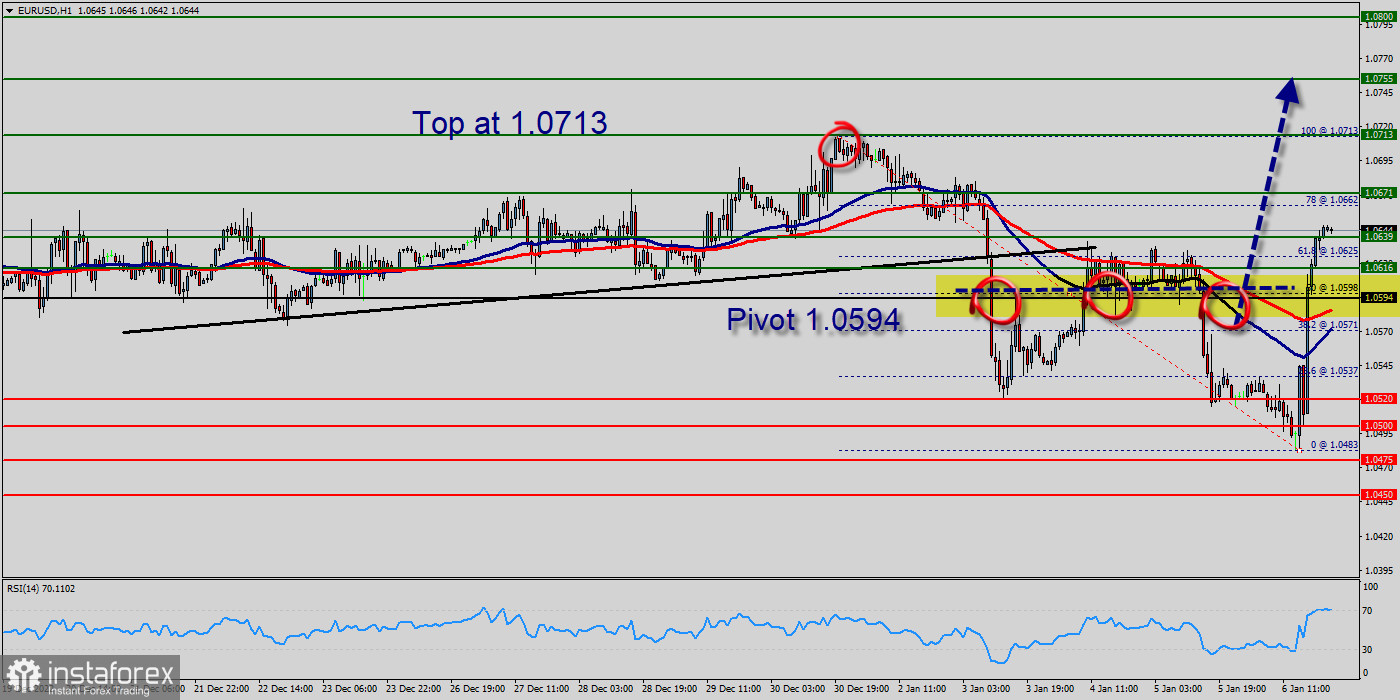
The EUR/USD pair traded lower and closed the day in the red near the price of 1.0548. Today it, on the contrary, grew a little, having risen to the level of 1.0594. On the hourly chart the EUR/USD pair is still trading below the moving average line MA (100) H1 (1.0594). The situation is similar on the four-hour chart. Based on the foregoing, it is probably worth sticking to the south direction in trading, and as long as the EUR/USD pair remains below MA 100 H1, it may be necessary to look for entry points to sell for the formation of a correction. The EUR/USD pair hit the weekly pivot point (1.0594) and resistance 1, because of the series of relatively equal highs and equal lows. But, the pair has dropped down in order to bottom at the point of 10520. Hence, the major support was already set at the level of 1.0520. Moreover, the double bottom is also coinciding with the major support this week.
Additionally, the RSI is still calling for a strong bullish market as well as the current price is also above the moving average 100. Therefore, it will be advantageous to sell below the resistance area of 1.0594 with the first target at 1.0500. From this point, if the pair closes below the weekly pivot point of 1.0594, the EUR/USD pair may resume it movement to 1.0500 to test the weekly support 1. the, continue towards 1.0450 (the weekly support 2).
Thereupon, the price spot of .0639 and 1.0616 remains a significant resistance zone. Therefore, the possibility that the Euro will have a downside momentum is rather convincing and the structure of the fall does not look corrective. The market indicates a bearish opportunity below .0639 and 1.0616 it will be a good signal to sell below .0639 or 1.0616. with the first target of 1.0520. It is equally important that it will call for downtrend in order to continue bearish trend towards 1.0475. Besides, the weekly support 3 is seen at the level of 1.0450. However, traders should watch for any sign of a bullish rejection that occurs around 1.0639. The level of 1.0639 coincides with 61.8% of Fibonacci, which is expected to act as a major resistance today. Since the trend is below the 61.8% Fibonacci level, the market is still in a downtrend. Overall, we still prefer the bearish scenario.
Weekly bearish outlook:
Thereupon, the price spot of .0639 and 1.0616 remains a significant resistance zone. Therefore, the possibility that the Euro will have a downside momentum is rather convincing and the structure of the fall does not look corrective. The market indicates a bearish opportunity below .0639 and 1.0616 it will be a good signal to sell below .0639 or 1.0616. with the first target of 1.0520. It is equally important that it will call for downtrend in order to continue bearish trend towards 1.0475. Besides, the weekly support 3 is seen at the level of 1.0450. However, traders should watch for any sign of a bullish rejection that occurs around 1.0639. The level of 1.0639 coincides with 61.8% of Fibonacci, which is expected to act as a major resistance today. Since the trend is below the 61.8% Fibonacci level, the market is still in a downtrend. Overall, we still prefer the bearish scenario. Next targets : 1.0500 and 1.4200.
Le recensioni analitiche di InstaForex ti renderanno pienamente consapevole delle tendenze del mercato! Essendo un cliente InstaForex, ti viene fornito un gran numero di servizi gratuiti per il trading efficiente.


