 Rimani
Condizioni di trading
Strumenti


Trend analysis
GBP/USD will attempt to move up this week, from 1.2269 (closing of the last weekly candle) to 1.2360 - the 23.6% retracement level (red dotted line). Then, it will go to the 23.6% retracement level at 1.2477 (yellow dotted line), before rolling back downwards.
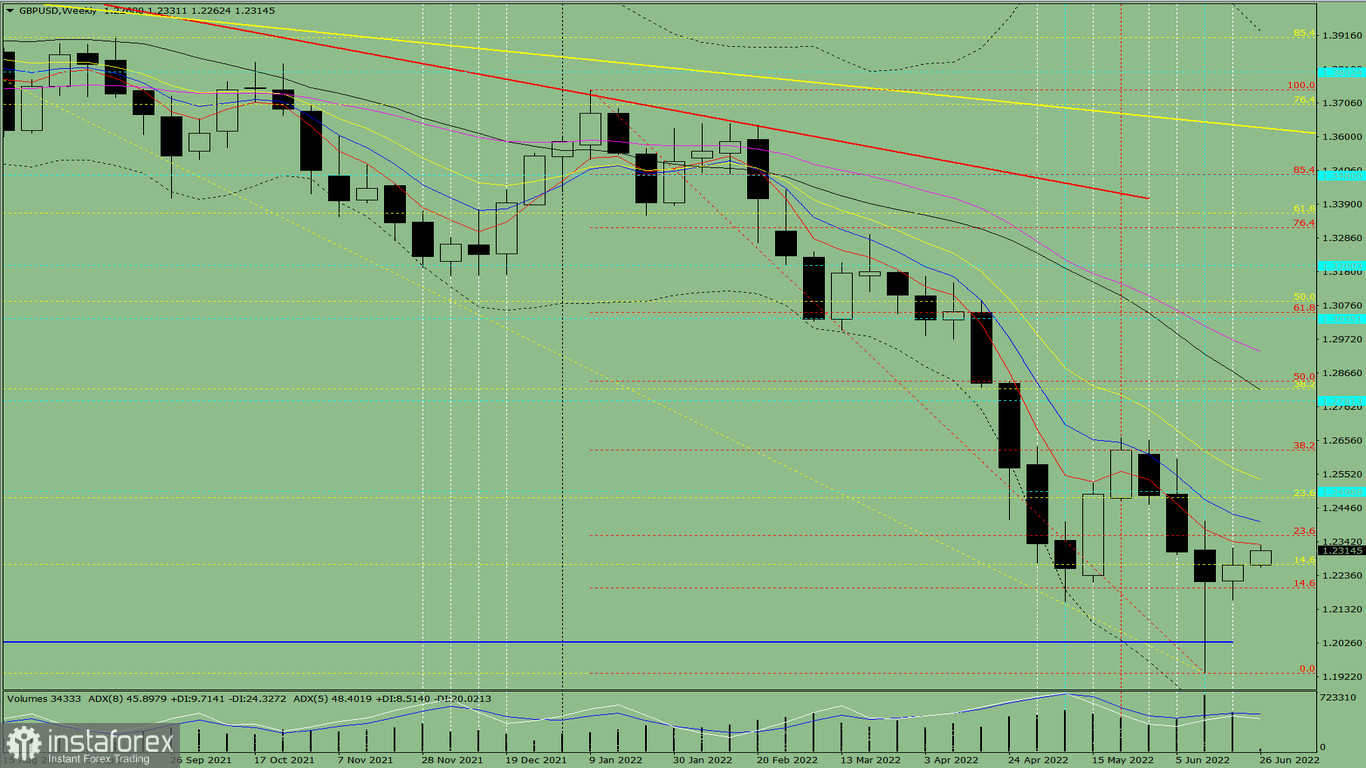
Fig. 1 (weekly chart)
comprehensive analysis:
Indicator analysis - uptrend
Fibonacci levels - uptrend
Volumes - uptrend
Candlestick analysis - uptrend
Trend analysis - uptrend
Bollinger bands - uptrend
Monthly chart - uptrend
All this points to an upward movement in GBP/USD.
Conclusion: The pair will have an upward trend, with no first lower shadow on the weekly white candle (Monday - up) and no second upper shadow (Friday - up).
And during the week, the price will rise from 1.2360 (closing of the last weekly candle) to the 23.6% retracement level at 1.2360 (red dotted line), move to the 23.6% retracement level at 1.2477 (yellow dotted line), then rollback downwards
Alternatively, the pair may climb up from 1.2269 (closing of the last weekly candle) to the 23.6% retracement level at 1.2360 (red dotted line), bounce back to the support level at 1.2030 (blue thick line), then go to the 14.6 % retracement level at 1.2197 (red dotted line).
Le recensioni analitiche di InstaForex ti renderanno pienamente consapevole delle tendenze del mercato! Essendo un cliente InstaForex, ti viene fornito un gran numero di servizi gratuiti per il trading efficiente.


