 Rimani
Condizioni di trading
Strumenti


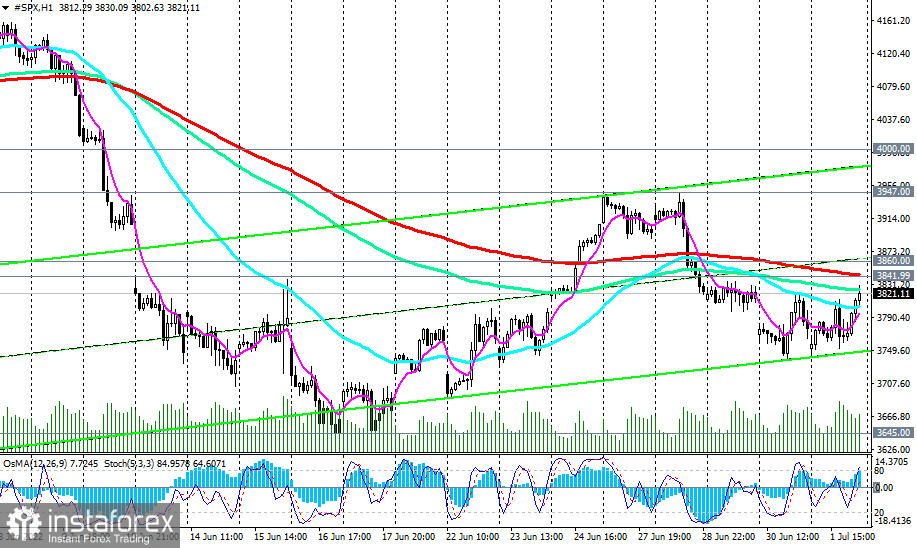
As of this writing, the S&P 500 CFDs are trading near 3821.00, 69 pips above today's opening price.
A break through the resistance levels of 3841.00 (200 EMA on the 1-hour chart), and 3860.00 (144 EMA on the weekly chart) may provoke further corrective growth towards the resistance level of 4000.00 (200 EMA on the 4-hour chart, 50 EMA and the upper line of the descending channel on the daily chart).
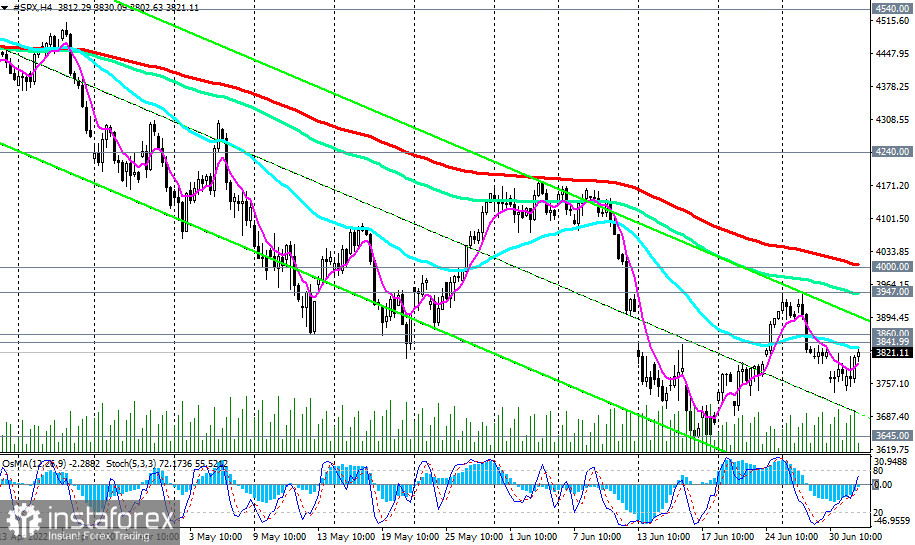
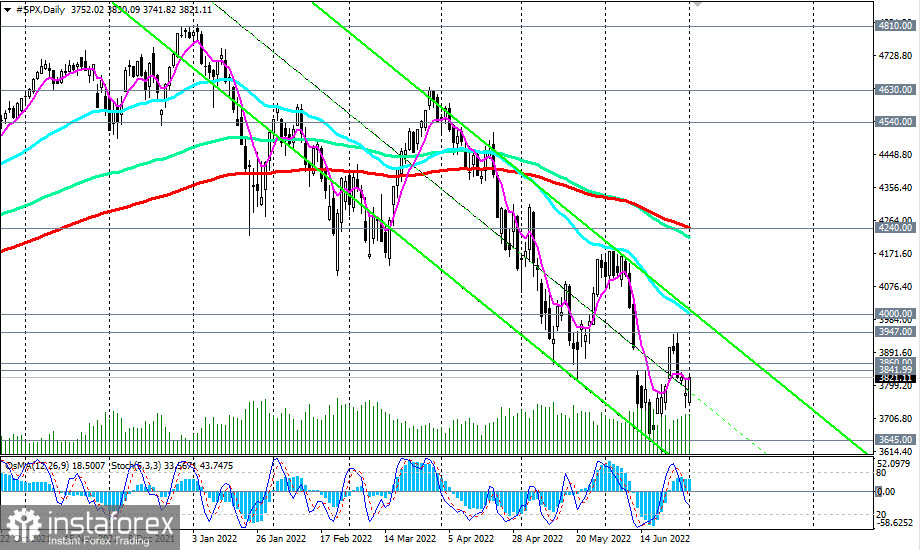
But despite the current upward correction, in general, and below the key resistance level of 4240.00 (200 EMA on the daily chart, 50 EMA and the upper line of the descending channel on the weekly chart), negative dynamics persist in S&P 500.
Therefore, near the current mark and resistance levels of 3841.00, 3860.00, a rebound and a resumption of decline are possible.
A breakdown of the local support level at 3740.00 will be a signal for the resumption of short positions, and a breakdown of the key support level of 3645.00 (200 EMA on the weekly chart) will be a signal for their increase.
In this case, the S&P 500 will move into the zone of a long-term bear market, and the decline targets will be the key support levels of 2700.00 (144 EMA on the monthly chart), 2500.00 (200 EMA on the monthly chart).
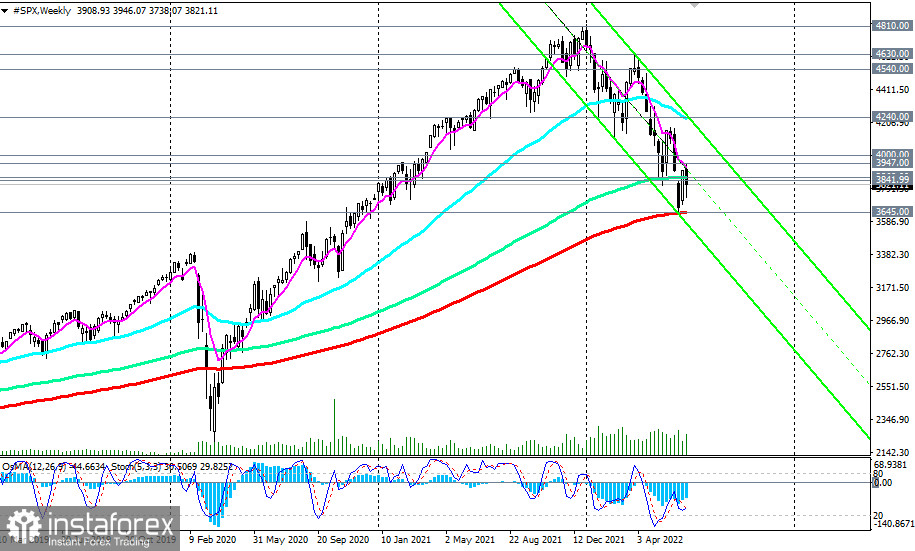
A breakdown of the key long-term support level of 3500.00 may finally break the long-term global bullish trend of the S&P 500, and perhaps, of the entire US stock market.
Support levels: 3740.00, 3645.00
Resistance levels: 3841.00, 3860.00, 3947.00, 4000.00, 4240.00
Trading Tips
Sell Stop 3737.00. Stop-Loss 3862.00. Target 3700.00, 3645.00, 3600.00
Buy Stop 3862.00. Stop-Loss 3737.00. Target 3947.00, 4000.00, 4240.00, 4540.00, 4630.00, 4800.00
Le recensioni analitiche di InstaForex ti renderanno pienamente consapevole delle tendenze del mercato! Essendo un cliente InstaForex, ti viene fornito un gran numero di servizi gratuiti per il trading efficiente.

