 Rimani
Condizioni di trading
Strumenti


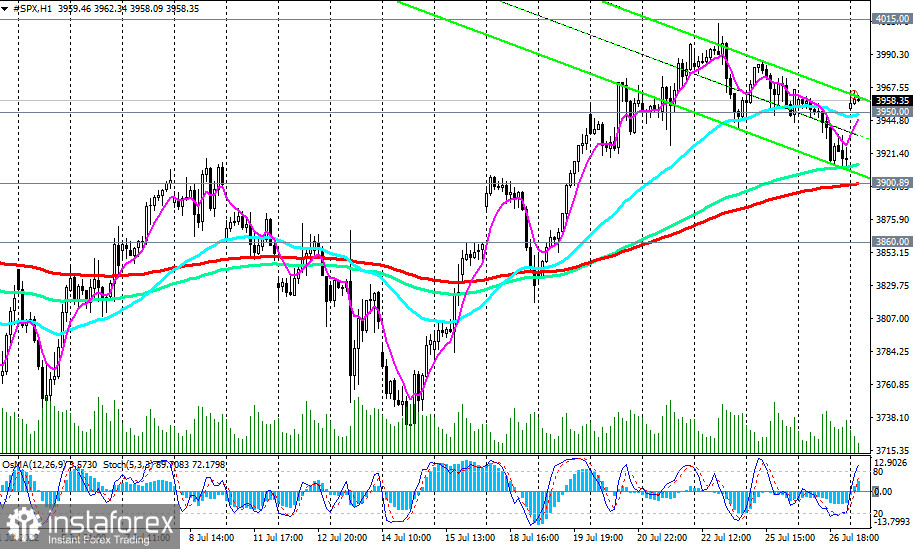
The S&P 500 CFD is trading near 3958.00, continuing to correct after its biggest drop since the start of the year to a key support level at 3660.00, separating the multi-year bullish trend from the bearish one.
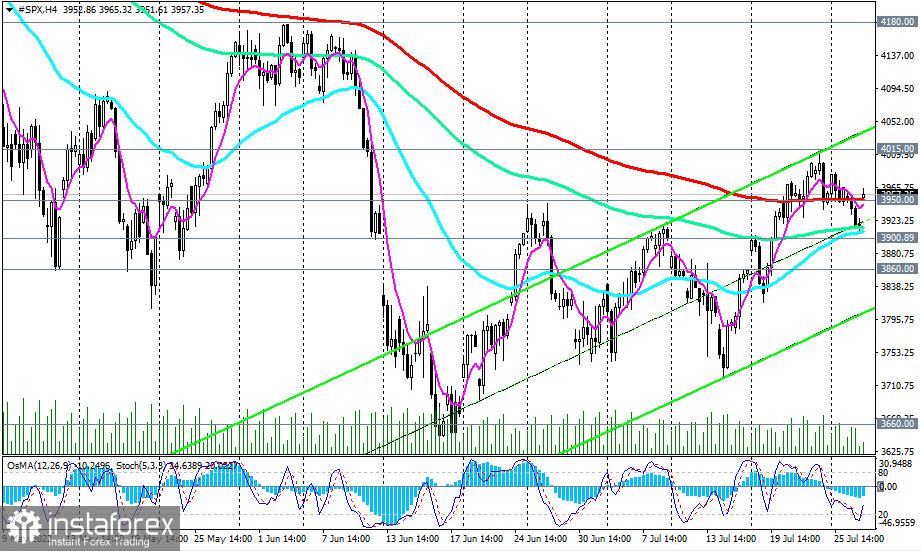
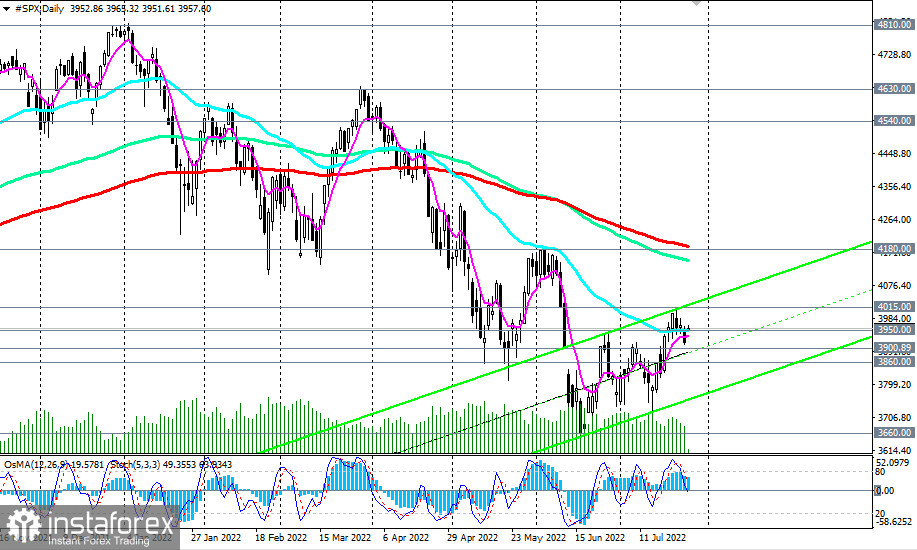
The S&P 500 CFD has been near the current mark and the support level of 3950.00 (200 EMA on the 4-hour chart, 50 EMA on the daily chart) for the 6th consecutive day.
Market participants are waiting for the Fed's decision on the interest rate (18:00 GMT) to determine the direction of further movement of the dollar and stock indices.
Probably, the breakdown of the important support level of 3950.00 in one direction or another will determine the direction of movement of the S&P 500 index for the next few weeks, at least until the next Fed meeting on September 20–21.
Confirming signals will also be the breakouts of the boundaries of the current range between the support levels of 3900.00 (200 EMA on the 1-hour chart) and resistance levels of 4015.00.
The upper limit of the rising channel on the daily chart also passes through the level of 4015.00.
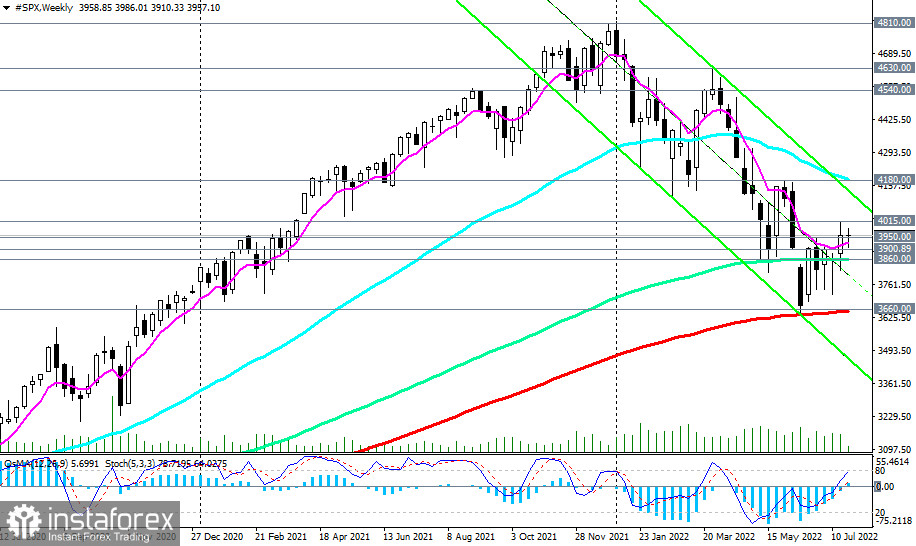
In case of its breakdown, the S&P 500 will head to the key resistance level 4180.00 (200 EMA on the daily chart and 50 EMA on the weekly chart). The breakdown of which will mark the end of the downward correction of the S&P 500, observed since the beginning of this year, from the local resistance level and a record high of 4810.00.
In an alternative scenario, and after the breakdown of the support levels 3900.00, 3860.00 (144 EMA on the weekly chart), the S&P 500 will again head to the key long-term support level of 3660.00 (200 EMA on the weekly chart), which separates the multi-year bullish trend from the bearish one. Its breakdown may finally break the long-term global bullish trend of the S&P 500 and, perhaps, the entire American stock market.
Support levels: 3950.00, 3900.00, 3860.00, 3660.00, 3600.00
Resistance levels: 4000.00, 4015.00, 4100.00, 4180.00, 4540.00, 4630.00, 4810.00
Trading Tips
Sell Stop 3890.00. Stop-Loss 4020.00. Take-profit 3860.00, 3660.00, 3600.00
Buy Stop 4020.00. Stop-Loss 3890.00. Take-profit 4100.00, 4180.00, 4200.00, 4300.00, 4400.00, 4540.00, 4630.00, 4810.00
Le recensioni analitiche di InstaForex ti renderanno pienamente consapevole delle tendenze del mercato! Essendo un cliente InstaForex, ti viene fornito un gran numero di servizi gratuiti per il trading efficiente.


