 Rimani
Condizioni di trading
Strumenti


The EUR/USD pair traded very calmly for most of the day on Wednesday. The day of the Fed meeting is always uncertain. The market can react completely differently to the results of the meeting, no matter how unambiguous they are. That is exactly what we got last night, when the key rate was raised by 0.75%, but the US dollar fell. The overall decline of the US currency was about 100 points, which is actually not that much. We said in previous articles that the market reaction can last about a day, since the European trading session will open in an hour, and European traders will also want to work out this event. Thus, we will not be at all surprised if the US dollar is already rising today. But in any case, we'll see. We believe that the dollar's decline last night is a completely illogical market reaction. A rate hike of 0.75% is still an aggressive tightening of monetary policy, even if the markets were already ready for such a decision.
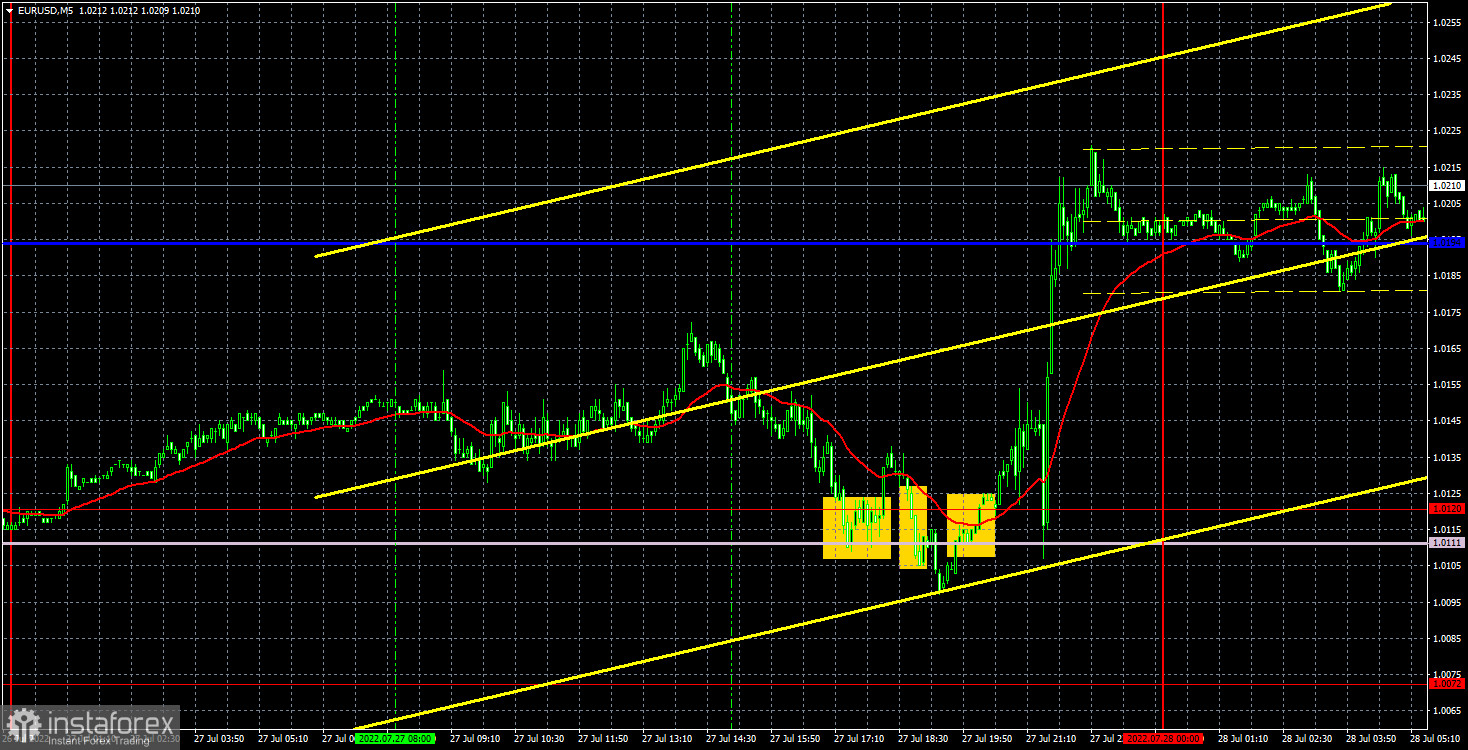
As for trading signals, there is not much to say here. The pair did not form a single signal at the European session, but it started to get frankly nervous and "dance" near the Senkou Span B line at the US session. In principle, we would not risk opening positions even a few hours before the announcement of the results of the meeting. Bounces and breakthroughs of 1.0120 and 1.0111 were uncertain and inaccurate. Therefore, the best decision was not to enter the market.
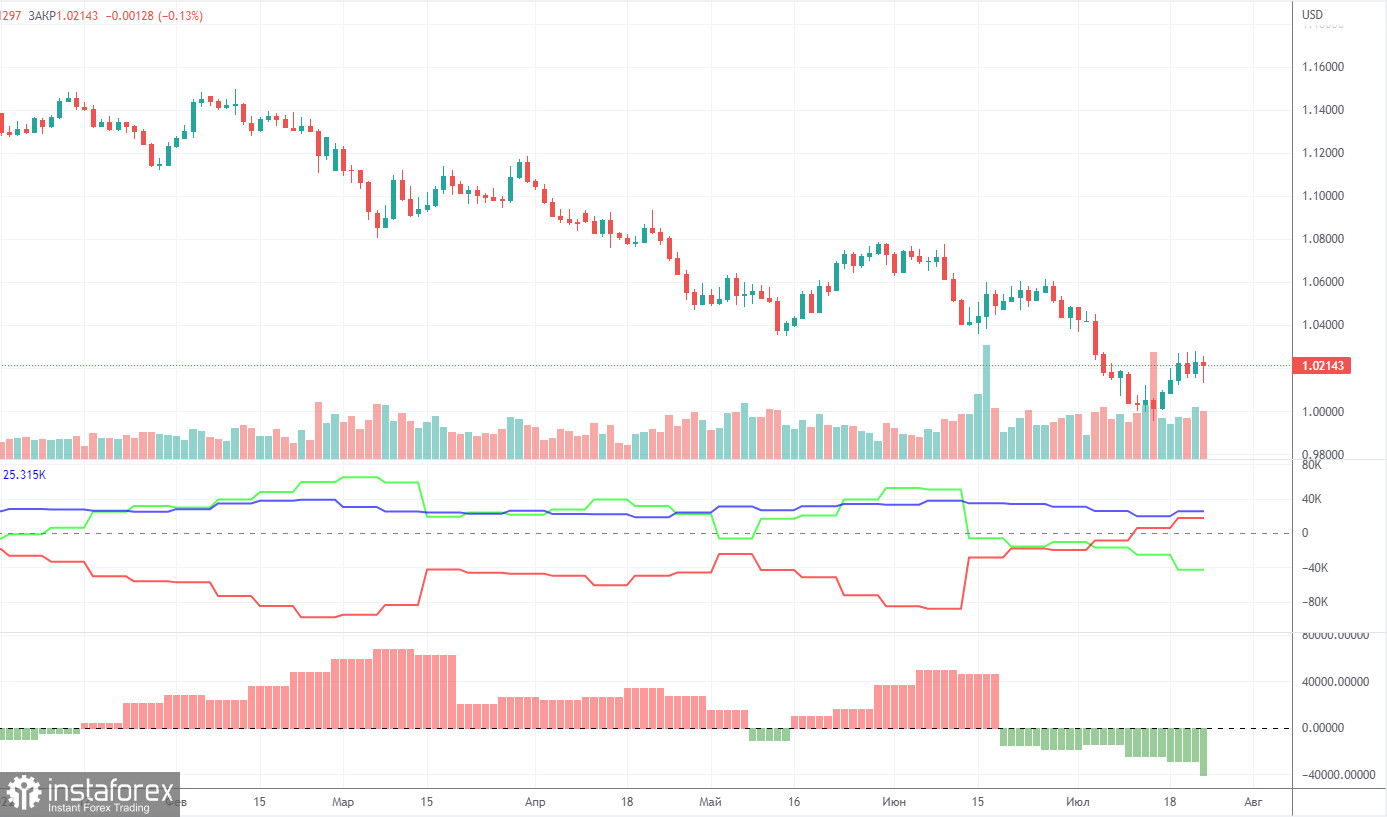
The Commitment of Traders (COT) reports on the euro over the past six months have raised a huge number of questions. The chart above clearly shows that for most of 2022 they showed an openly bullish mood of professional players, but at the same time, the euro was falling at the same time. At this time, the situation has changed, and NOT in favor of the euro. If earlier the mood was bullish, but the euro was falling, now the mood has become bearish and... the euro is also falling. Therefore, for the time being, we do not see any grounds for the euro's growth, because the vast majority of factors remain against it. During the reporting week, the number of long positions decreased by 1,300, while the number of shorts in the non-commercial group increased by 16,000. Accordingly, the net position decreased again, by almost 15,000 contracts. The mood of the big players remains bearish and even intensifies in recent weeks. From our point of view, this fact very eloquently indicates that at this time even professional traders do not believe in the euro. The number of longs is lower than the number of shorts for non-commercial traders by 43,000. Therefore, we can state that not only does the demand for the US dollar remain high, but that the demand for the euro is quite low. This may lead to a new, even greater fall of the euro. In principle, over the past few months or even more, the euro has not been able to show even a tangible correction, not to mention something more. The highest upward movement was about 400 points.
Overview of the EUR/USD pair. July 28. The bright future of the US currency.
Overview of the GBP/USD pair. July 28. Boris Johnson may not be out of work for long.
Forecast and trading signals for GBP/USD on July 28. Detailed analysis of the movement of the pair and trading transactions.
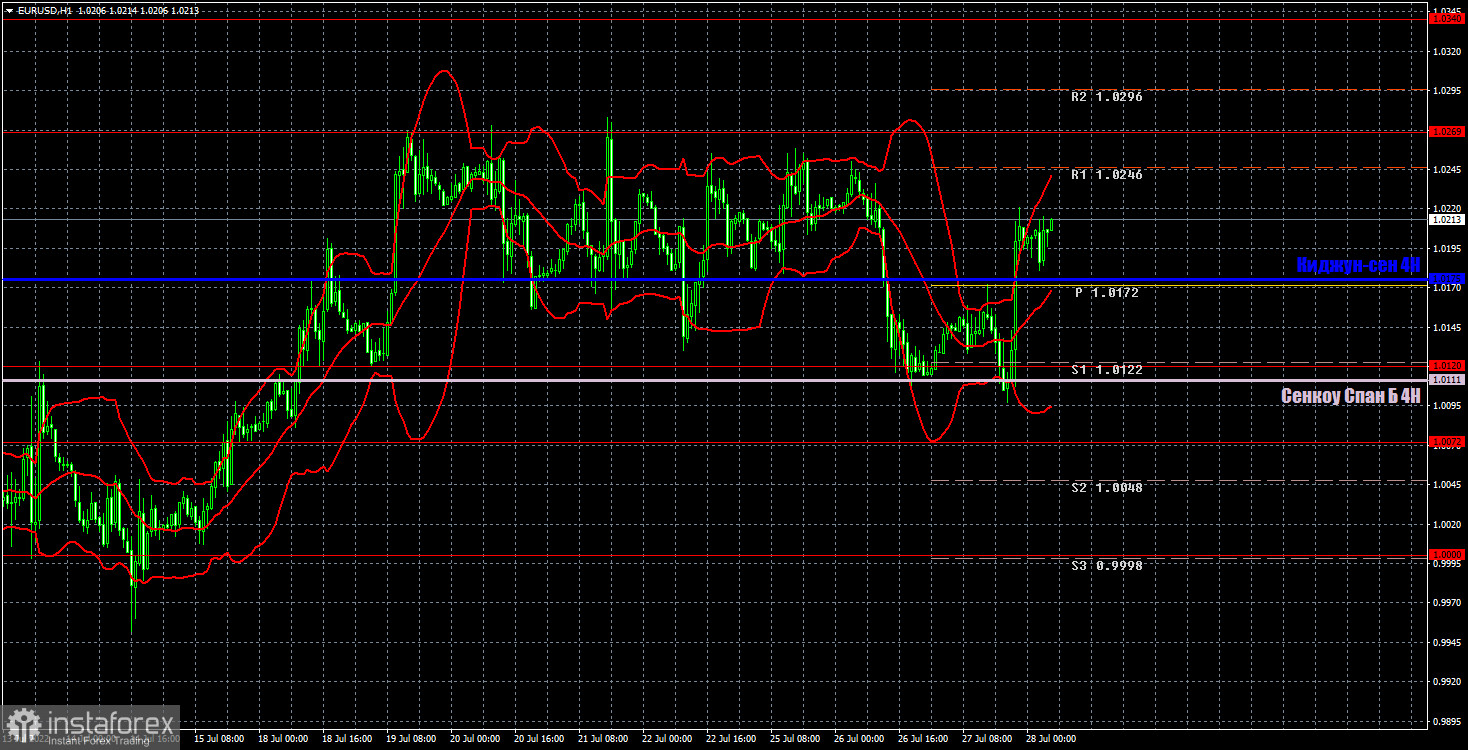
The pair showed a strong movement on the hourly timeframe on Tuesday and Wednesday evening. Despite the fact that the pair fell by 120 points, then rose by 120 points, it still remained inside the horizontal channel of 1.0120-1.0269. We warned that such an option is also possible, when the pair will simply remain inside the flat. Thus, at the moment it is even impossible to say whether the pair's chances for a new fall or a new growth have increased. We highlight the following levels for trading on Thursday - 1.0000, 1.0072, 1.0120, 1.0269, 1.0340-1.0366, 1.0485, as well as Senkou Span B (1.0111) and Kijun-sen lines (1.0175). Ichimoku indicator lines can move during the day, which should be taken into account when determining trading signals. There are also secondary support and resistance levels, but no signals are formed near them. Signals can be "rebounds" and "breakthrough" extreme levels and lines. Do not forget about placing a Stop Loss order at breakeven if the price has gone in the right direction for 15 points. This will protect you against possible losses if the signal turns out to be false. No important events or reports scheduled in the European Union again. However, the US will publish a report on GDP for the second quarter. It is difficult for us to say whether there will be a reaction to it, since today during the day traders can continue to work out the results of the Fed meeting.
Support and Resistance Levels are the levels that serve as targets when buying or selling the pair. You can place Take Profit near these levels.
Kijun-sen and Senkou Span B lines are lines of the Ichimoku indicator transferred to the hourly timeframe from the 4-hour one.
Support and resistance areas are areas from which the price has repeatedly rebounded off.
Yellow lines are trend lines, trend channels and any other technical patterns.
Indicator 1 on the COT charts is the size of the net position of each category of traders.
Indicator 2 on the COT charts is the size of the net position for the non-commercial group.
Le recensioni analitiche di InstaForex ti renderanno pienamente consapevole delle tendenze del mercato! Essendo un cliente InstaForex, ti viene fornito un gran numero di servizi gratuiti per il trading efficiente.


