 Rimani
Condizioni di trading
Strumenti


The GBP/USD currency pair continued to remain above the Senkou Span B line on Friday, which is very good for its prospects. It did not surpass the 1.1212 level, but not all levels are overcome the first time, so there is nothing wrong with that. The pound may continue rising this week, as it has overcome the descending trend line and the Ichimoku indicator line. Last Friday, the UK released a report on GDP for the second quarter, which caused a very restrained market reaction. It completely ignored US secondary statistics. The pound continues to trade in a very volatile manner, and the main factors that influence it are geopolitics and the "foundation". More precisely, it would be better to say that now they have weakened their influence on the pound, as they imply a further fall in the British currency. However, this is where the danger lies for traders. Now they may decide that the global downward trend is over, and now they can buy the pound "with all the money." However, on the 24-hour timeframe it is perfectly clear that the pound has not really overcome any important resistance yet, therefore, the fall may resume.
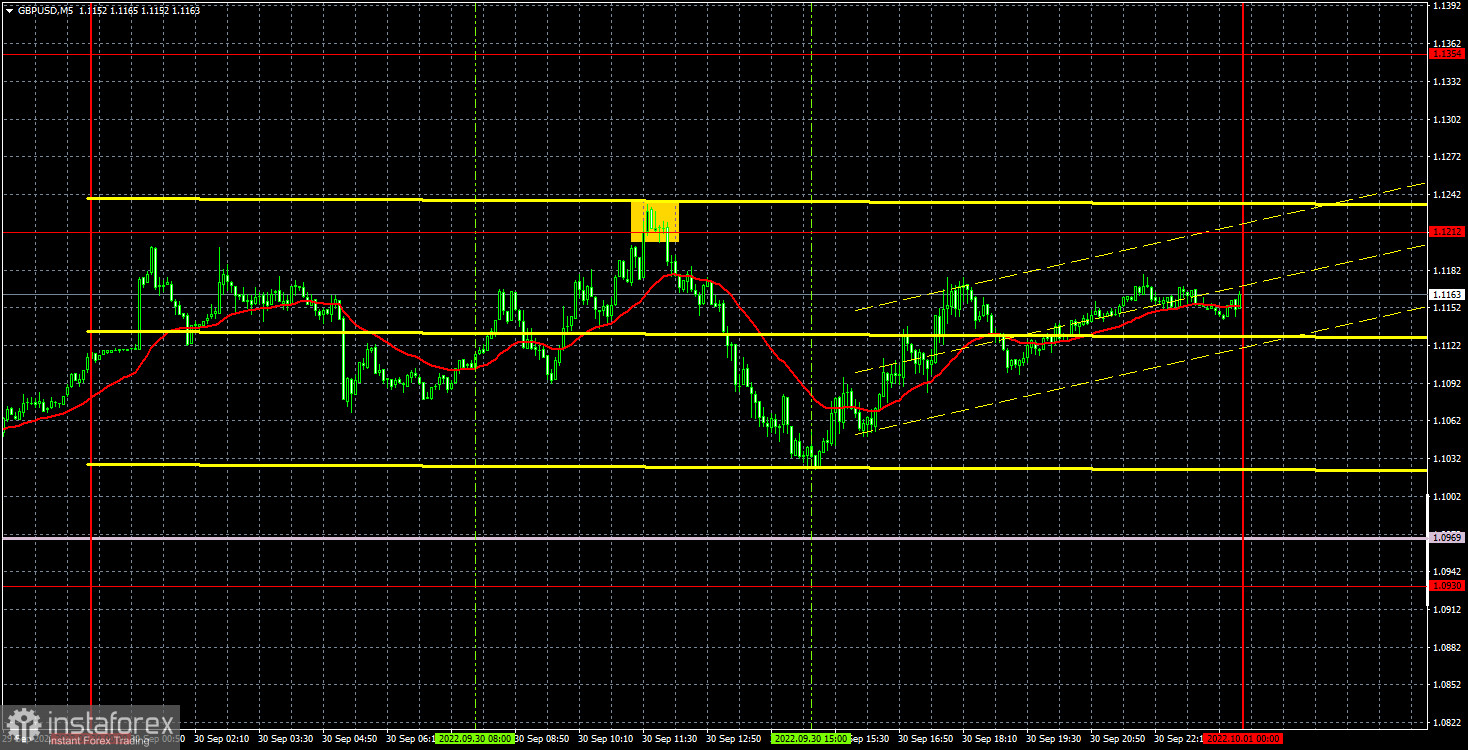
Only one trading signal was formed on Friday - the price rebounded from the extreme level of 1.1212, after which it went down at a high of about 167 points. Unfortunately, it failed to reach the nearest target level of 1.0969, but the position could still be closed in profit, manually in the late afternoon. Then the profit on it would be about 60 points, which is also not bad.
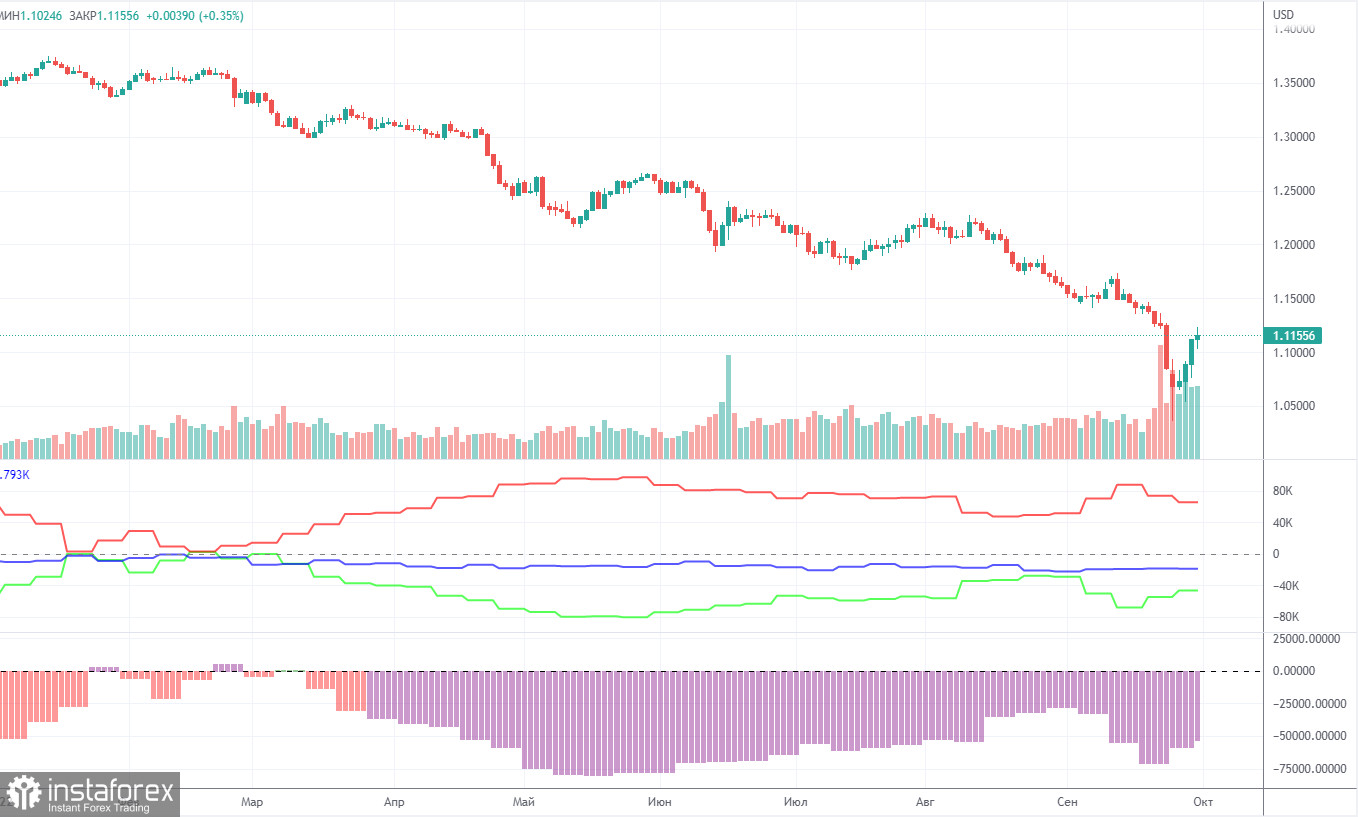
The latest Commitment of Traders (COT) report on the British pound was again very eloquent. During the week, the non-commercial group opened 18,500 long positions and 10,100 short positions. Thus, the net position of non-commercial traders increased by another 8,400, which is quite a lot for the pound. We could assume that the actions of the big players and the movement of the pound have finally begun to coincide, only the report is released with a three-day delay and simply does not include the last three days of trading, when the pound showed growth. The net position indicator has been actively falling again in recent weeks, and the mood of the big players remains "pronounced bearish", which is clearly seen in the second indicator in the chart above (purple bars below zero = bearish mood). Now it has begun a new growth, so the British pound can formally count on growth. But, if we recall the situation with the euro, then there are big doubts that based on the COT reports, we can expect a strong growth of the pair. How can you count on it if the market buys the dollar more than the pound? The non-commercial group now has a total of 106,000 shorts and 59,000 longs open. The difference, as we can see, is still large. The euro cannot show growth if the major players are bullish, and the pound will suddenly be able to grow if the mood is bearish? We remain skeptical about the long-term growth of the British currency.
Overview of the EUR/USD pair. October 3. Geopolitics can bring down the euro with renewed vigor.
Overview of the GBP/USD pair. October 3. The clouds are gathering over Liz Truss. Will she follow in the footsteps of Boris Johnson or become the new "Margaret Thatcher"?
Forecast and trading signals for EUR/USD on October 3. Detailed analysis of the movement of the pair and trading transactions.
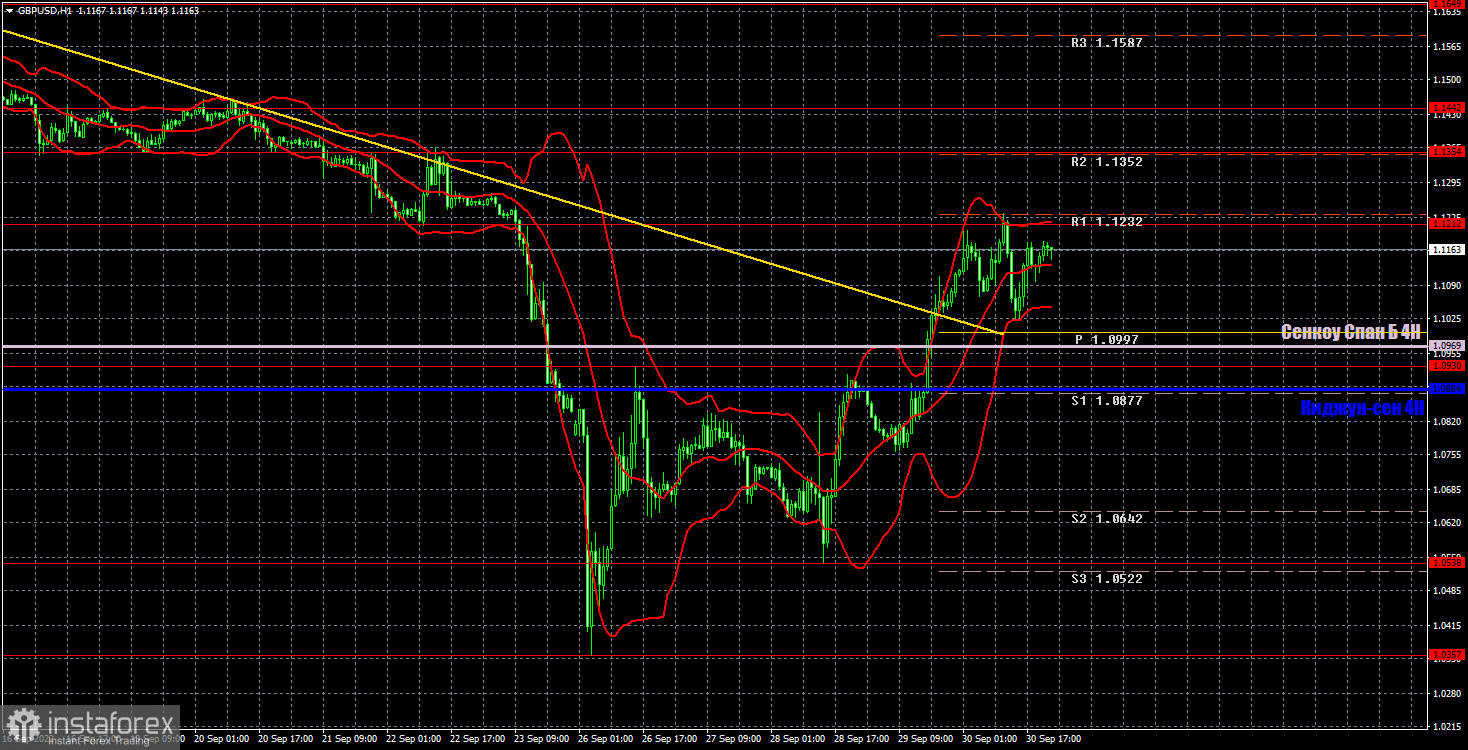
The pound/dollar pair, as we see it now, has broken the downward trend on the hourly timeframe, as all key levels and lines have been overcome. But this is in the short term, since similar levels and lines on the higher time frames have not been overcome. Obviously, sooner or later the price will be able to surpass them, why not now? However, we still fear for the further prospects of the pound, so we call for caution when opening any positions. At least, do not forget about Stop Loss. We highlight the following important levels for October 3: 1.0538, 1.0930, 1.1212, 1.1354, 1.1442. Senkou Span B (1.0969) and Kijun-sen (1.0884) lines can also be sources of signals. Signals can be "rebounds" and "breakthroughs" of these levels and lines. The Stop Loss level is recommended to be set to breakeven when the price passes in the right direction by 20 points. Ichimoku indicator lines can move during the day, which should be taken into account when determining trading signals. The chart also contains support and resistance levels that can be used to take profits on trades. Only manufacturing PMIs for September will be published in the UK and the US on Monday. The US index is more important, and the market may react to it.
Support and Resistance Levels are the levels that serve as targets when buying or selling the pair. You can place Take Profit near these levels.
Kijun-sen and Senkou Span B lines are lines of the Ichimoku indicator transferred to the hourly timeframe from the 4-hour one.
Support and resistance areas are areas from which the price has repeatedly rebounded off.
Yellow lines are trend lines, trend channels and any other technical patterns.
Indicator 1 on the COT charts is the size of the net position of each category of traders.
Indicator 2 on the COT charts is the size of the net position for the non-commercial group.
Le recensioni analitiche di InstaForex ti renderanno pienamente consapevole delle tendenze del mercato! Essendo un cliente InstaForex, ti viene fornito un gran numero di servizi gratuiti per il trading efficiente.


