 Rimani
Condizioni di trading
Strumenti


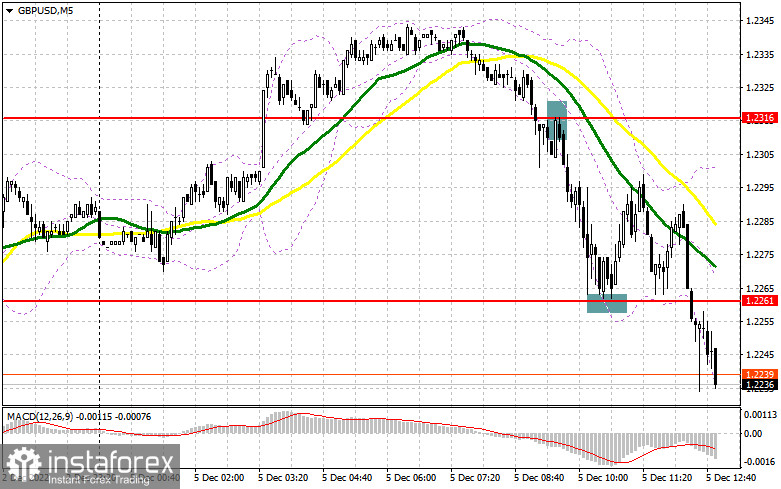
In the morning article, I turned your attention to the levels of 1.2316 - 1.2261 and recommended making decisions with these levels in focus. Now, let's look at the 5-minute chart and figure out what actually happened. A breakout and a downward retest of 1.2316 gave a sell signal. The pair dropped to 1.2261, allowing traders to take about 50 pips of profit. After a decline to 1.2261 and weak data on the PMI indices, buyers returned to the market. entry points to ling positions. A false breakout created entry points in long positions. The upward movement totaled about 35 pips. After that, the pressure on the pair increased once again. For the afternoon, the technical outlook has changed.
What is needed to open long positions on GBP/USD:
The UK Services PMI Index was in line with forecasts. It triggered a small correction of the pair. Bulls are likely to push the quotes higher following the release of the US PMI reports. The US will unveil the Composite PMI Index and the ISM Services Index. If they drop, the pound sterling is sure to climb against the US dollar. A contraction in the PMI Indices could signal an onset of a recession in the US economy, which may start next year. If the figures differ from the forecasts, namely an increase or slowdown in contraction, the pound/dollar pair is likely to lose momentum. If so, I advise you to trade according to the morning scenario. A false breakout of 1.2209 could generate a buy signal with the prospect of a rise to 1.2283 where moving averages are benefitting the sellers. A breakout and a downward retest of this level will help buyers assert strength. It may also provide an excellent buying opportunity at 1.2340. A more distant target will be a new monthly high of 1.2410 where I recommend locking in profits. If the bulls fail to push the pair to 1.2209, bears will take the advantage of it. In this case, it would be wise to open long positions only at the support level of 1.2138. You could buy GBP/USD immediately at a bounce from 1.2075 or a low of 1.19999, keeping in mind an upward intraday correction of 30-35 pips.
What is needed to open short positions on GBP/USD:
Bears are trying to push the pair from monthly highs, signaling their readiness to take control. However, only strong US economic reports will help them keep the pressure on the pound sterling in the afternoon. It is crucial for sellers to push the price below 1.2283. This is why this is a pivot level for traders. Only a false breakout of this level will give an excellent entry point into short positions with the prospect of a decline to 1.2209. A breakout of 1.2209 may take place only amid the upbeat ISM Services Index data. An upward retest of 1.2209 will be a good sell signal with a view to the price falling to 1.2138. At this level, the bears will face strong resistance levels. A more distant target will be the 1.2075 level where I recommend locking in profits. If the pair does not slide below 1.2283, which is most likely, the bulls will regain the upper hand. The pound sterling will approach new highs, triggering a breakout of 1.2340. A false breakout of this level will generate a market entry point for short positions amid a downward move. If bears show no energy at this level, you could sell GBP/USD immediately at a bounce from 1.2410, keeping in mind a downward intraday correction of 30-35 pips.
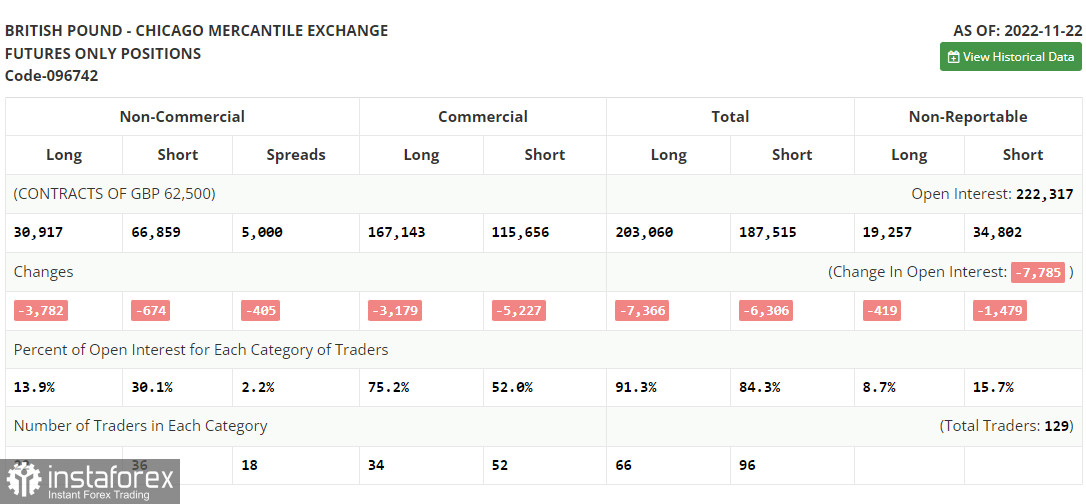
The COT report (Commitment of Traders) for November 22 logged a decrease in both short and long positions. A contraction in business activity in the British economy indicates that the economy is gradually sliding into a recession. The Bank of England is ready to sacrifice the national economic output as its main priority is to tame soaring inflation. According to the latest reports, headline inflation has been rising in the UK. This is why It is hardly surprising that traders prefer sitting on the sidelines. They are not sure whether to buy or sell the pound sterling. This week, Fed Chairman Jerome Powell will tell the market about the monetary policy projections for the next year. If the tone of his speech does not match market expectations, the pound sterling will immediately face strong bearish pressure, leading to a large sell-off of the pair at the end of this month and the start of next. The latest COT report revealed that long non-commercial positions decreased by 3,782 to 30,917, while short non-commercial positions declined by 674 to 66,859, which led to an increase in the negative value of the non-commercial net position to -35,942, against -32,834 a week earlier. GBP/USD closed last week higher at 1.1892 against 1.1885 a week ago.
Indicators' signals:
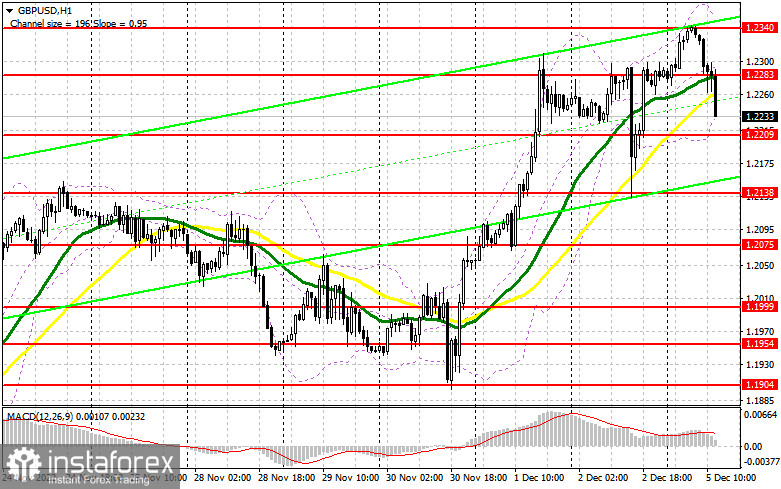
Trading is carried out below the 30 and 50 daily moving averages. It indicates a downward correction.
Moving averages
Note: The period and prices of moving averages are considered by the author on the H1 (1-hour) chart and differ from the general definition of the classic daily moving averages on the daily D1 chart.
Bollinger Bands
If GBP/USD drops, the indicator's lower border at 1.2250 will serve as support.
Description of indicators
Le recensioni analitiche di InstaForex ti renderanno pienamente consapevole delle tendenze del mercato! Essendo un cliente InstaForex, ti viene fornito un gran numero di servizi gratuiti per il trading efficiente.


