 Rimani
Condizioni di trading
Strumenti


The economic calendar was almost empty on Friday. No important reports were published in the EU, the United Kingdom, and the Unites States.
However, it was possible to highlight the U.S. Pending Home Sales Index, which grew by 2.5% in December. Despite the positive data, no one paid attention to them.
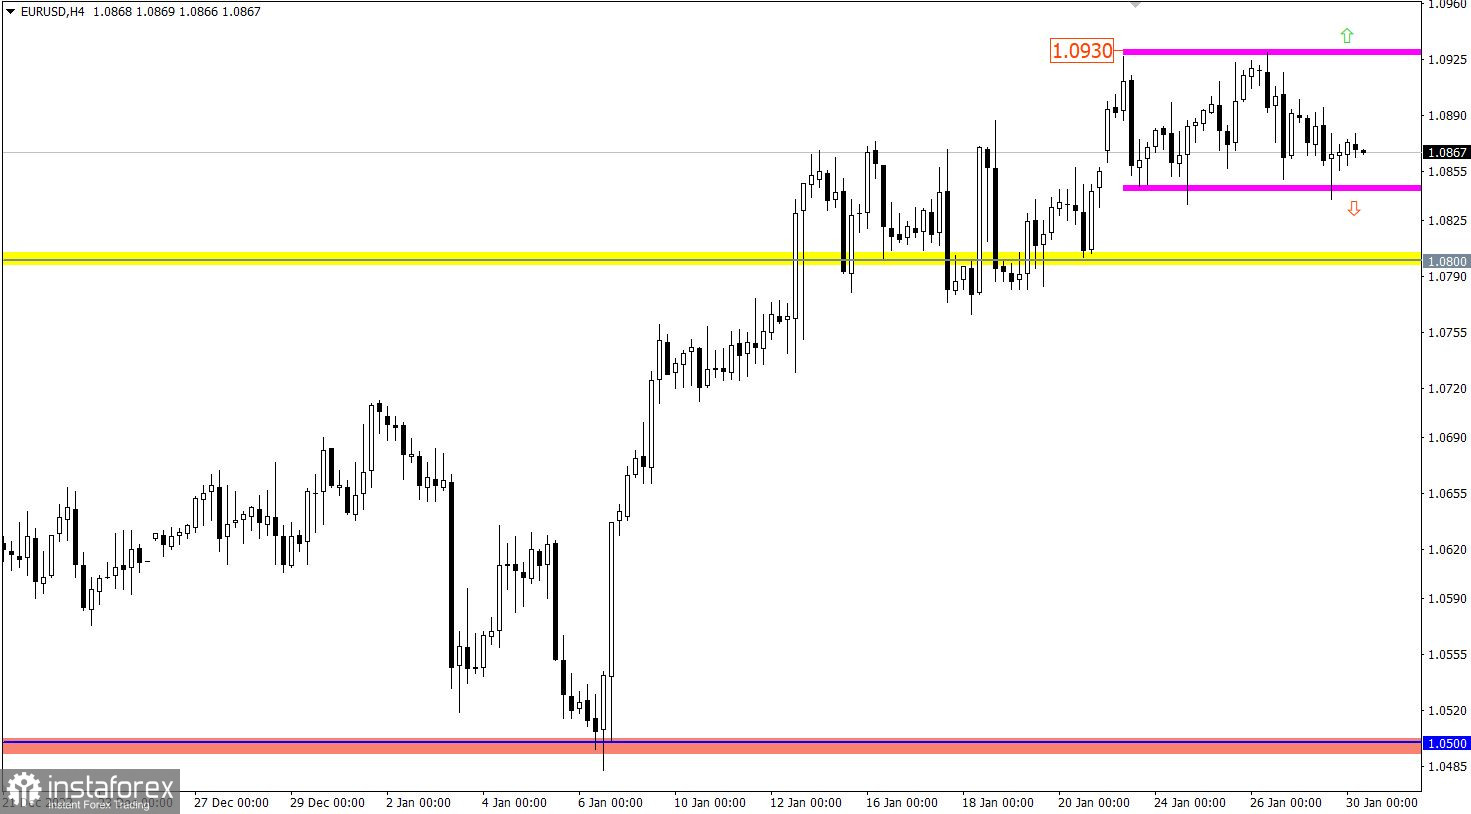
The EURUSD currency pair has been within the sideways movement of 1.0840/1.0930 throughout the past week. This amplitude indicates the process of accumulation of trading forces, where, in the light of upcoming economic events, it will be won back in the form of price leverage.
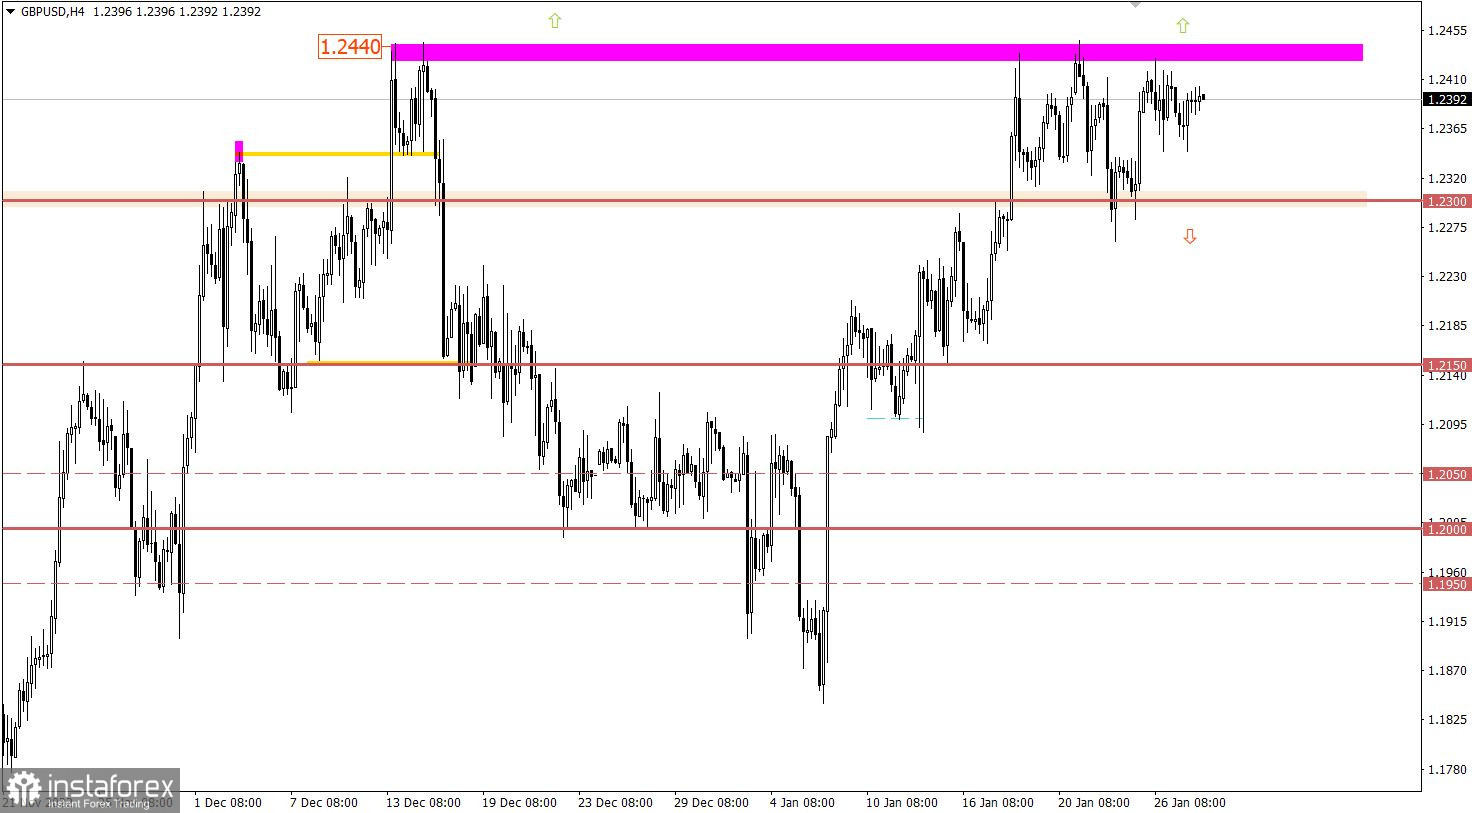
Despite the fact that the GBPUSD currency pair had a wider amplitude compared to EURUSD, in general terms, everything is the same. The borders of price fluctuations are clamped between the values of 1.2300 and 1.2440, where the quote has been moving for almost two weeks. In fact, this price movement, as well as for the euro, indicates the process of accumulation of trading forces. Otherwise, a full-blown correction would have already occurred in the market.

The economic calendar is traditionally empty on Monday. No important reports are expected. But do not be discouraged as the heat will begin at the middle of the week: the results of the Fed meeting, followed by the ECB, the Bank of England, inflation in the EU, and U.S. Department of Labor report. We expect high volatility in the financial markets.
In this situation, where there is a price movement looped in a sideways range, it is appropriate to work according to the method of breaking through one or another stagnation border. As a result, with a high degree of probability, an outgoing impulse will arise, which will lead to the completion of the flat, indicating the subsequent movement.
Based on the above, consider two possible scenarios:
The upward move will be relevant if the price holds above 1.0940 in a four-hour period. This move will lead towards the 1.1000 psychological level.
The downward move will be applied if the price holds below 1.0840 in a four-hour period. This move could initially push the euro towards 1.0800. After that, a transition to the full-blown correction stage is possible.
Based on the fact that the flat still takes place in the market, the tactics of working by the method of breaking through one or another range boundary is considered the most optimal.
Let's concretize the above:
The downward move will be relevant if the price holds below the level of 1.2300 in a four-hour period. This step can lead to the formation of a full-blown correction.
The upward move is taken into account in case of a stable holding of the price above the value of 1.2450 in a four-hour period. This move will indicate a continuation of the upward trend.
The candlestick chart type is white and black graphic rectangles with lines above and below. With a detailed analysis of each individual candle, you can see its characteristics relative to a particular time frame: opening price, closing price, intraday high and low.
Horizontal levels are price coordinates, relative to which a price may stop or reverse its trajectory. In the market, these levels are called support and resistance.
Circles and rectangles are highlighted examples where the price reversed in history. This color highlighting indicates horizontal lines that may put pressure on the asset's price in the future.
The up/down arrows are landmarks of the possible price direction in the future.
Le recensioni analitiche di InstaForex ti renderanno pienamente consapevole delle tendenze del mercato! Essendo un cliente InstaForex, ti viene fornito un gran numero di servizi gratuiti per il trading efficiente.


