 Rimani
Condizioni di trading
Strumenti


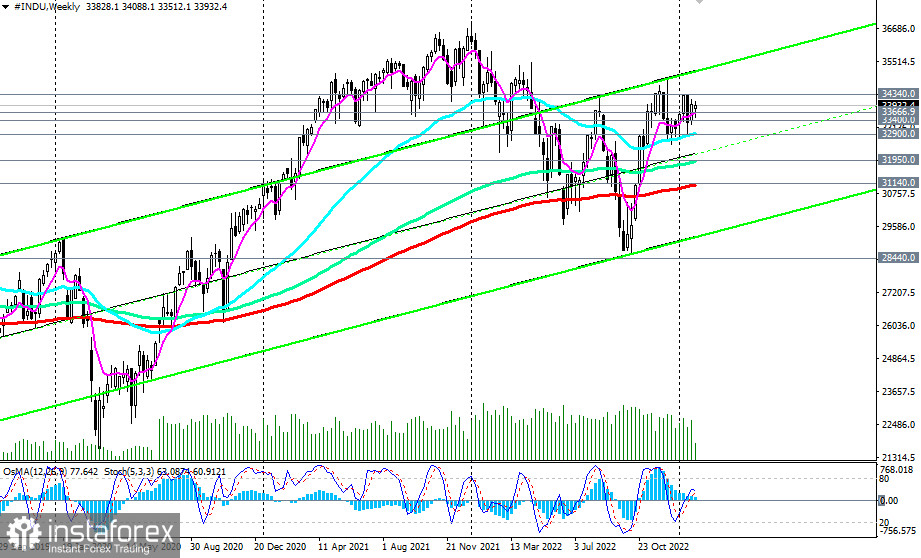
In general, the upward dynamics of the U.S. stock market and its three major stock indices remains.
Futures on one of the major U.S. stock indices, the Dow Jones Industrial Average (CFD #INDU in the MT4 trading terminal), have grown by 1.03% since the beginning of this year compared to the closing price at the end of 2022. As of writing, it is trading near 34,000.0, 1,100 points above the 32,900.0 key long-term support level (200 EMA, 144 EMA on the daily chart and 50 EMA on the weekly chart).
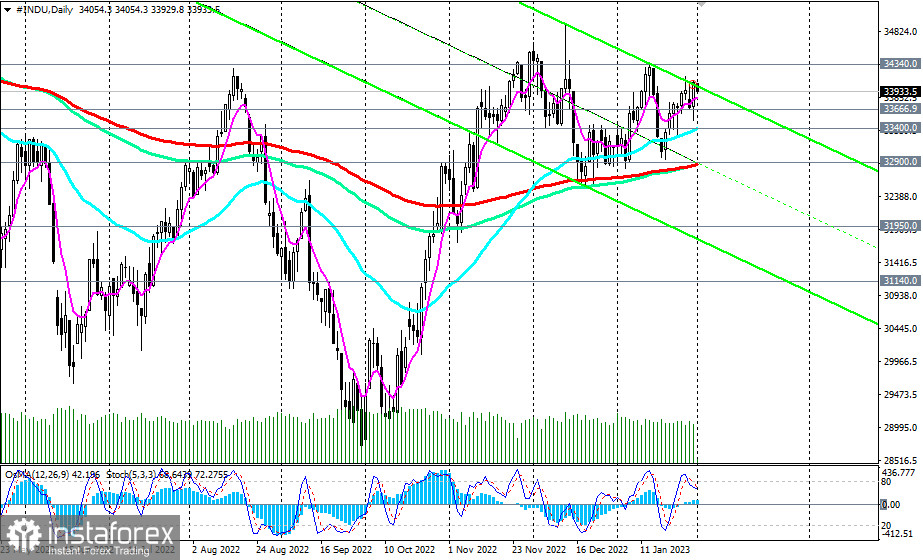
Above these support levels, long positions remain preferable. The breakdown of yesterday's high at 34,088.0 will signal growth. The nearest growth targets are the recent local highs at 34,340.0, 34,550.0, and 34,900.0.
Alternatively, the first signal to open short positions will be a breakdown of the important short-term support level 33,667.0 (200 EMA on the 1-hour chart), and confirmation signals will be a breakdown of the 33,400.0 support level (200 EMA on the 4-hour chart and 50 EMA on the daily chart).
The breakdown of support levels 32,900.0 and 32,600.0 increases the risks of the DJIA moving into the bear market zone. The breakdown of the 31,140.0 long-term support level (200 EMA on the weekly chart) and then the 28,440.0 level (200 EMA on the monthly chart) will break the long-term DJIA bullish trend and, perhaps, the entire U.S. stock market.
Support levels: 33667.0, 33400.0, 32900.0, 32560.0, 31950.0, 31140.0
Resistance Levels:34340.0, 34550.0, 34900.0, 35000.0, 35350.0
Trading scenarios
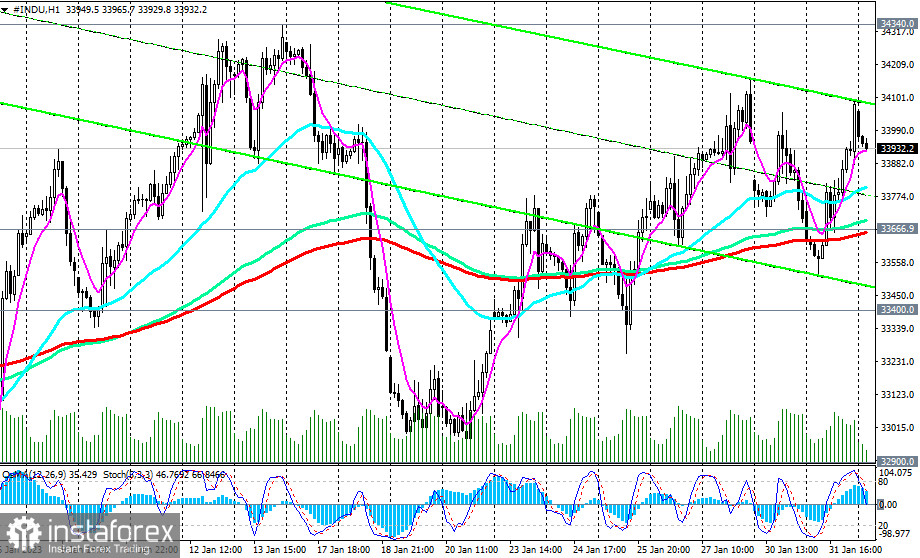
Sell Stop 33880.0. Stop-Loss 34090.0. Take-Profit 33667.0, 33400.0, 32900.0, 32560.0, 31950.0, 31140.0
Buy Stop 34090.0. Stop-Loss 33880.0. Take-Profit 34000.0, 34340.0, 34550.0, 34900.0, 35000.0, 35350.0
Le recensioni analitiche di InstaForex ti renderanno pienamente consapevole delle tendenze del mercato! Essendo un cliente InstaForex, ti viene fornito un gran numero di servizi gratuiti per il trading efficiente.


