 Rimani
Condizioni di trading
Strumenti


The GBP/USD pair managed to correct into the medium-term bull market zone amid a weak U.S. dollar, rising above the key levels 1.2140 (200 EMA on the daily chart), 1.2240 (50 EMA on the weekly chart).
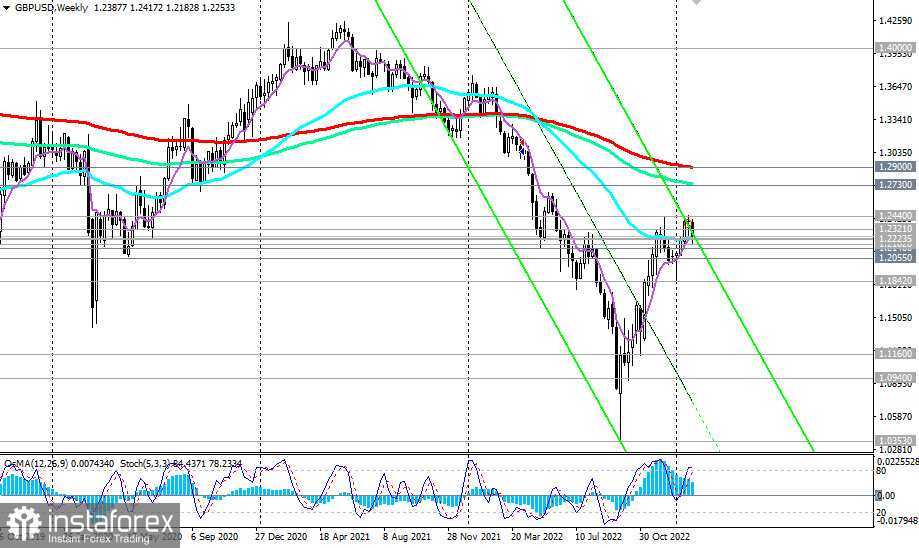
Despite the corrective growth (since the end of September), below the key resistance levels 1.2730 (144 EMA on the weekly chart), 1.2900 (200 EMA on the weekly chart), the long-term and global downward trend of the pair persists, making short positions still preferable.
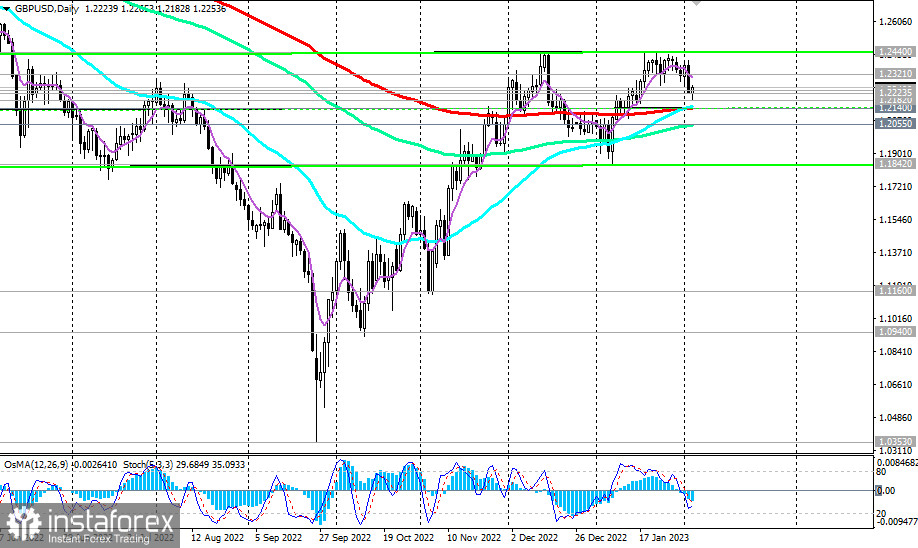
A consecutive breakdown of support levels 1.2140, 1.2055 (144 EMA on the daily chart) will return the GBP/USD to the long-term bear market zone, sending it towards the September lows near the 1.0400 mark. The first signal to open short positions may be a breakdown of the important short-term support level 1.2223 (200 EMA on the 4-hour chart), and the confirmation signal may be the local support level (and yesterday's low) 1.2182.

In an alternative scenario, GBP/USD will continue to rise towards the key resistance levels 1.2730, 1.2900. The first and fastest signal to resume long positions will be a breakdown of the short-term resistance level 1.2277 (200 EMA on the 15-minute chart), and a confirming one will be a breakdown of the important short-term resistance level 1.2321 (200 EMA on the 1-hour chart). Growth targets are key resistance levels 1.2730, 1.2900.
Support levels: 1.2240, 1.2223, 1.2182, 1.2140, 1.2100, 1.2055, 1.2000, 1.1160, 1.0940
Resistance levels: 1.2277, 1.2321, 1.2400, 1.2440, 1.2500, 1.2600, 1.2730, 1.2800, 1.2900
Trading scenarios
Sell Stop 1.2210. Stop-Loss 1.2290. Take-Profit 1.2182, 1.2140, 1.2100, 1.2055, 1.2000, 1.1160, 1.0940
Buy Stop 1.2290.Stop-Loss 1.2210. Take-Profit 1.2321, 1.2400, 1.2440, 1.2500, 1.2600, 1.2730, 1.2800, 1.2900
Le recensioni analitiche di InstaForex ti renderanno pienamente consapevole delle tendenze del mercato! Essendo un cliente InstaForex, ti viene fornito un gran numero di servizi gratuiti per il trading efficiente.


