 Rimani
Condizioni di trading
Strumenti


When to open long positions on EUR/USD:
In my morning article, I turned your attention to 1.0764 and recommended making decisions with this level in focus. Now, let's look at the 5-minute chart and figure out what actually happened. Despite a slight rise in the euro in the morning, it failed to reach 1.0764. It lacked few pips to give a good entry point into short positions. For the afternoon, the technical outlook remained the same.
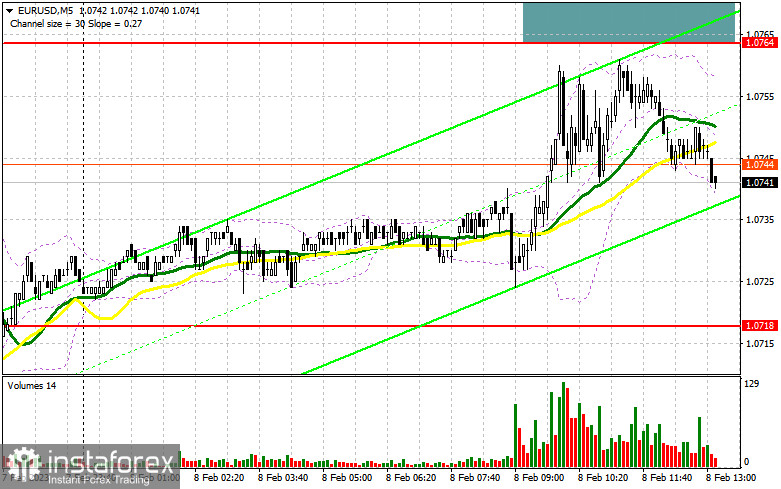
During the American session, several Fed policymakers, namely John Williams, Michael S. Barr, and Christopher Wallace, are scheduled to deliver speeches. Their rhetoric is likely to be hawkish. They are expected to call for more rate increases as Jerome Powell did yesterday. If so, the euro should climb higher. However, one cannot be absolutely sure. The US wholesale inventories report is also on tap. If the pressure on the euro returns, which is more likely, it is better to pay attention to the support level of 1.0718 formed in the morning. At this level, moving averages are passing. They are benefiting the bulls. Only after a false breakout, I would advise you to go long. The pair could grow to 1.0764. It failed to reach this level earlier. A breakout and a downward retest of this level will generate a new entry point into long positions with the prospect of an increase to 1.0795. A breakout of this level will also force the bears to close their Stop Loss orders and give an additional buy signal. The pair may rise to 1.0827 where I recommend locking in profits. However, one should not count on a significant upward movement today. If EUR/USD declines and buyers show no energy at 1.0718 in the afternoon, the pressure on the pair will stay. A decline of the price to this level will make buyers close Stop Loss orders. They will shift their focus to the support level of 1.0672, which is a weekly low. Only a false breakout of this level will lead to a buy signal. You could buy EUR/USD at a bounce from 1.0618 or 1.0569, keeping in mind an upward intraday correction of 30-35 pips.
When to open short positions on EUR/USD:
I anticipated a false breakout of 1.0764 in the morning. It appears it may take place during the American session. A rise and a false breakout of 1.0764 will indicate that big traders have entered the market. It will trigger a sell signal with the aim of declining to 1.0718, the support level formed yesterday. A breakout and an upward retest of this level will give a sell signal with the likelihood of a slide to 1.0672. It will facilitate the downward correction of the pair. A fall below this level against the background of Fed officials' hawkish comments will cause a stepper drop to 1.0618. At this level, I recommend locking in profits. If EUR/USD rises during the American session and bears show no energy at 1.0764, the bulls will try to regain the upper hand. In this case, I would advise you to postpone short positions until a false breakout of 1.0795. You could sell EUR/USD at a bounce from a high of 1.0827, keeping in mind a downward intraday correction of 30-35 pips.
COT report
The COT report for January 24 logged a rise in both short and long positions. Traders have significantly increased long positions following hawkish speeches of ECB policymakers. They are betting on further monetary tightening by the ECB and the Fed's dovish stance. The US regulator may reduce the pace of tightening for the second time in a row. Weak macro stats on the US economy, namely a drop in retail sales and a slowdown in inflation may force the central bank to take a pause in rate hikes to avoid any damage. This week, several central banks will hold their meetings. Their results will eventually determine the trajectory of the euro/dollar pair. According to the COT report, long positions of the non-commercial group of traders increased by 9,464 to 237,743 while short positions advanced by 2,099 to 103,394. At the end of the week, the total non-commercial net position rose to 134,349 from 126,984. It appears investors believe in the upside potential of the euro. Nevertheless, they are waiting for more clues from central banks regarding interest rates. The weekly closing price grew to 1.0919 from 1.0833.

Indicators' signals:
Trading is carried out above the 30 and 50 daily moving averages, which indicates the likelihood of a rise in the afternoon.
Moving averages
Note: The period and prices of moving averages are considered by the author on the H1 (1-hour) chart and differ from the general definition of the classic daily moving averages on the daily D1 chart.
Bollinger Bands
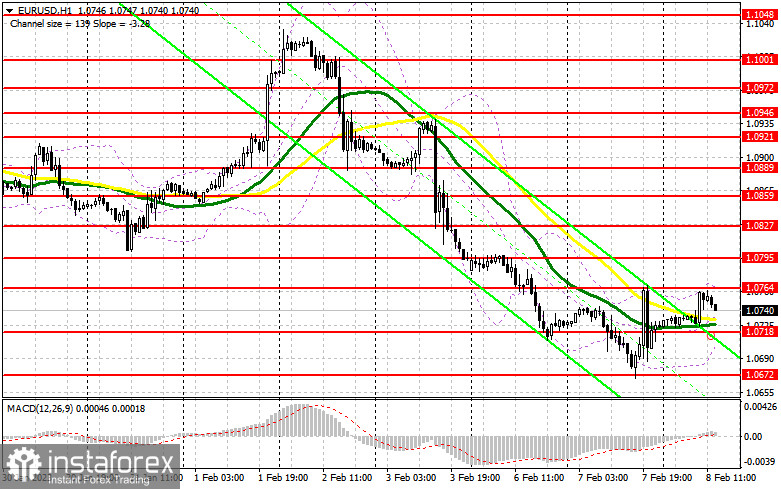
If EUR/USD moves up, the indicator's upper border at 1.0770 will serve as resistance. In case of a decline, the indicator's lower border at 1.0710 will act as support.
Description of indicators
Le recensioni analitiche di InstaForex ti renderanno pienamente consapevole delle tendenze del mercato! Essendo un cliente InstaForex, ti viene fornito un gran numero di servizi gratuiti per il trading efficiente.


