 Rimani
Condizioni di trading
Strumenti

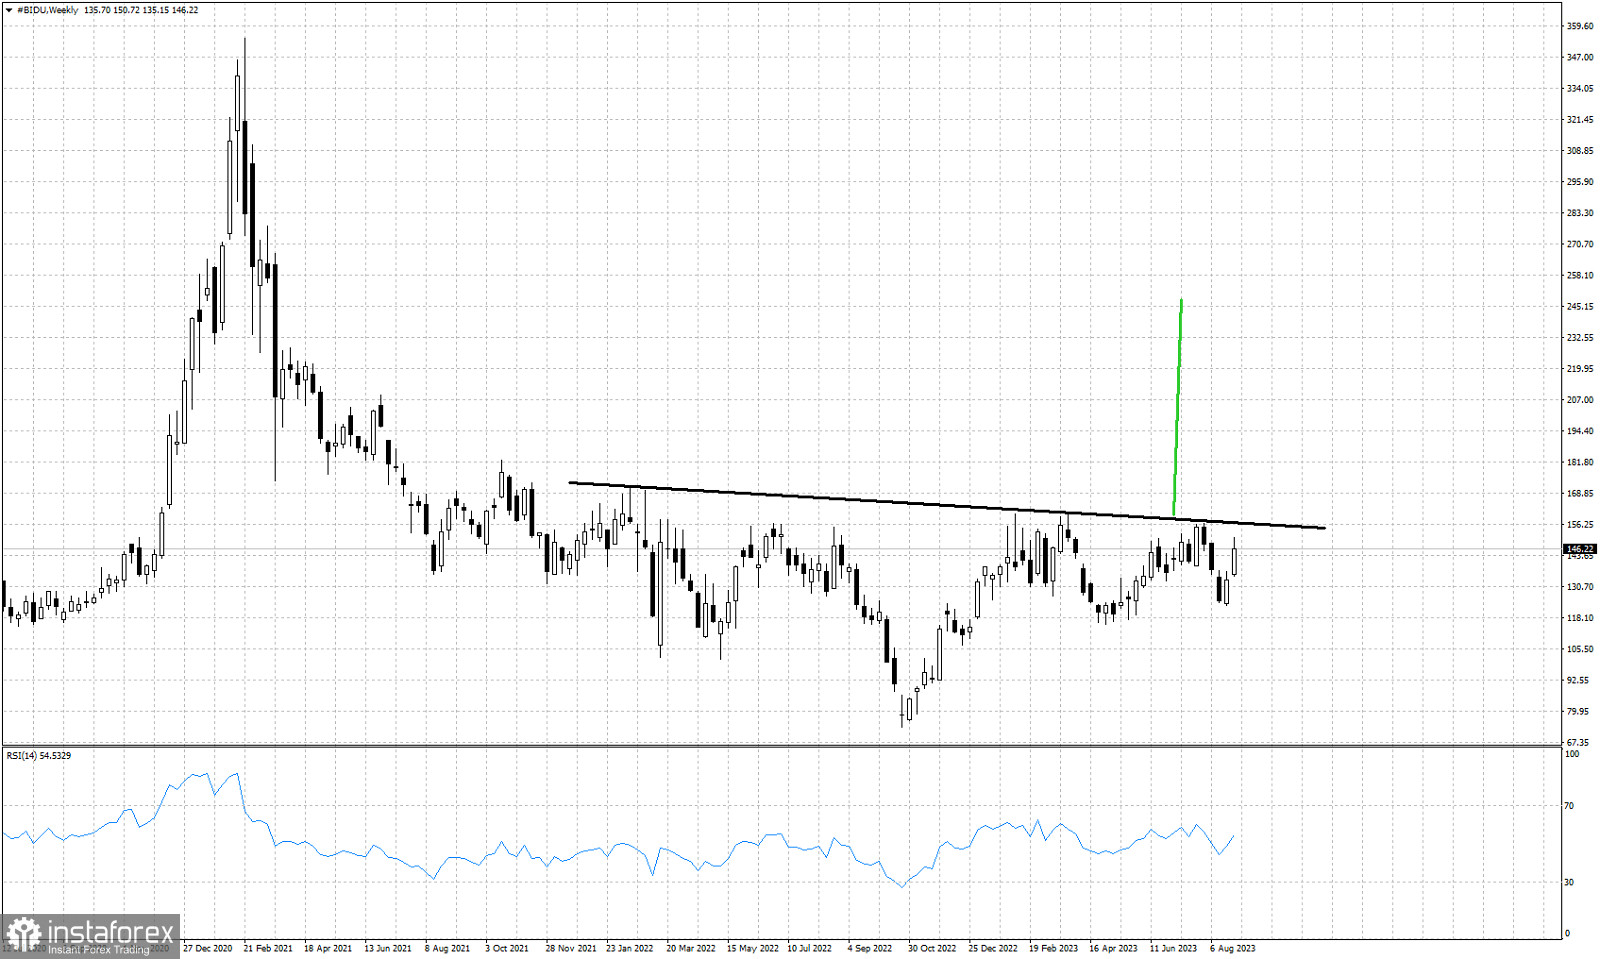
Black line -resistance neckline
green line- potential upside according to inverted head and shoulders pattern
In previous posts we talked about the potential inverted head and shoulders pattern in BIDU stock chart. In the weekly chart we clearly see another attempt by bulls to challenge the black horizontal resistance neckline. Key resistance remains at $156.50. A break above this neckline resistance will be a major bullish signal. Price action over the past 2 years has confirmed the importance of this resistance trend line. So a break above it will be big news for the stock price. An activation of the inverted head and shoulders pattern could mean price could move towards $250.
Le recensioni analitiche di InstaForex ti renderanno pienamente consapevole delle tendenze del mercato! Essendo un cliente InstaForex, ti viene fornito un gran numero di servizi gratuiti per il trading efficiente.


