 Rimani
Condizioni di trading
Strumenti


A report from the National Association of Realtors says existing home sales in the United States increased 14.5% in February from the previous month to 4.58 million homes year-on-year. This indicator rose for the first time in 13 months, and the rise was the highest since July 2020. It is worth noting that economists predicted only a 5% increase. Analysts attribute the sharp rise in existing home sales to falling mortgage interest rates and note that this situation will not last long.
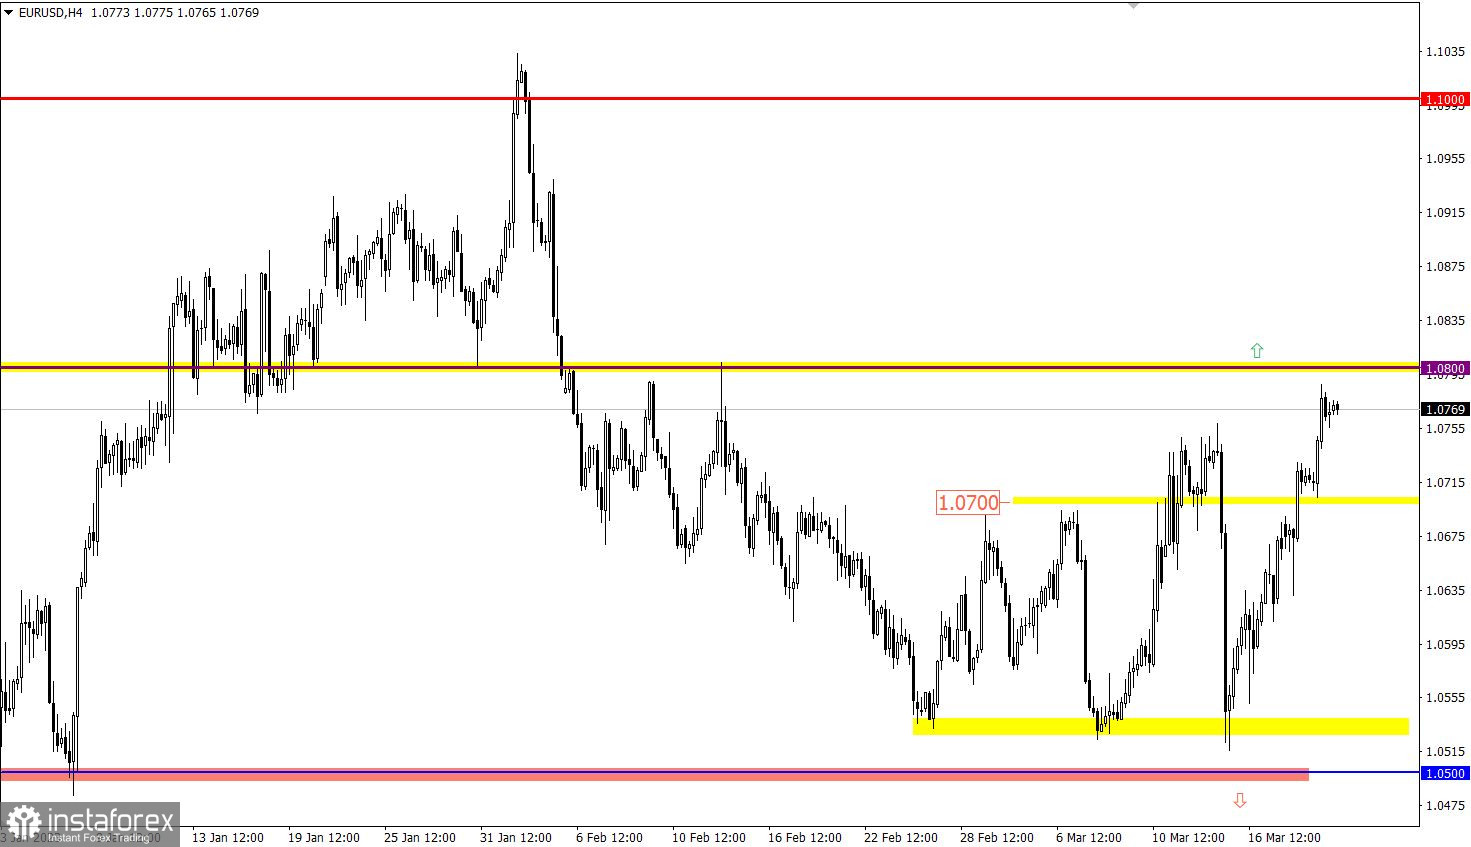
EUR/USD approached the 1.0800 resistance level. This suggests continued upward trend in the euro, which is gradually recovering after falling in February.
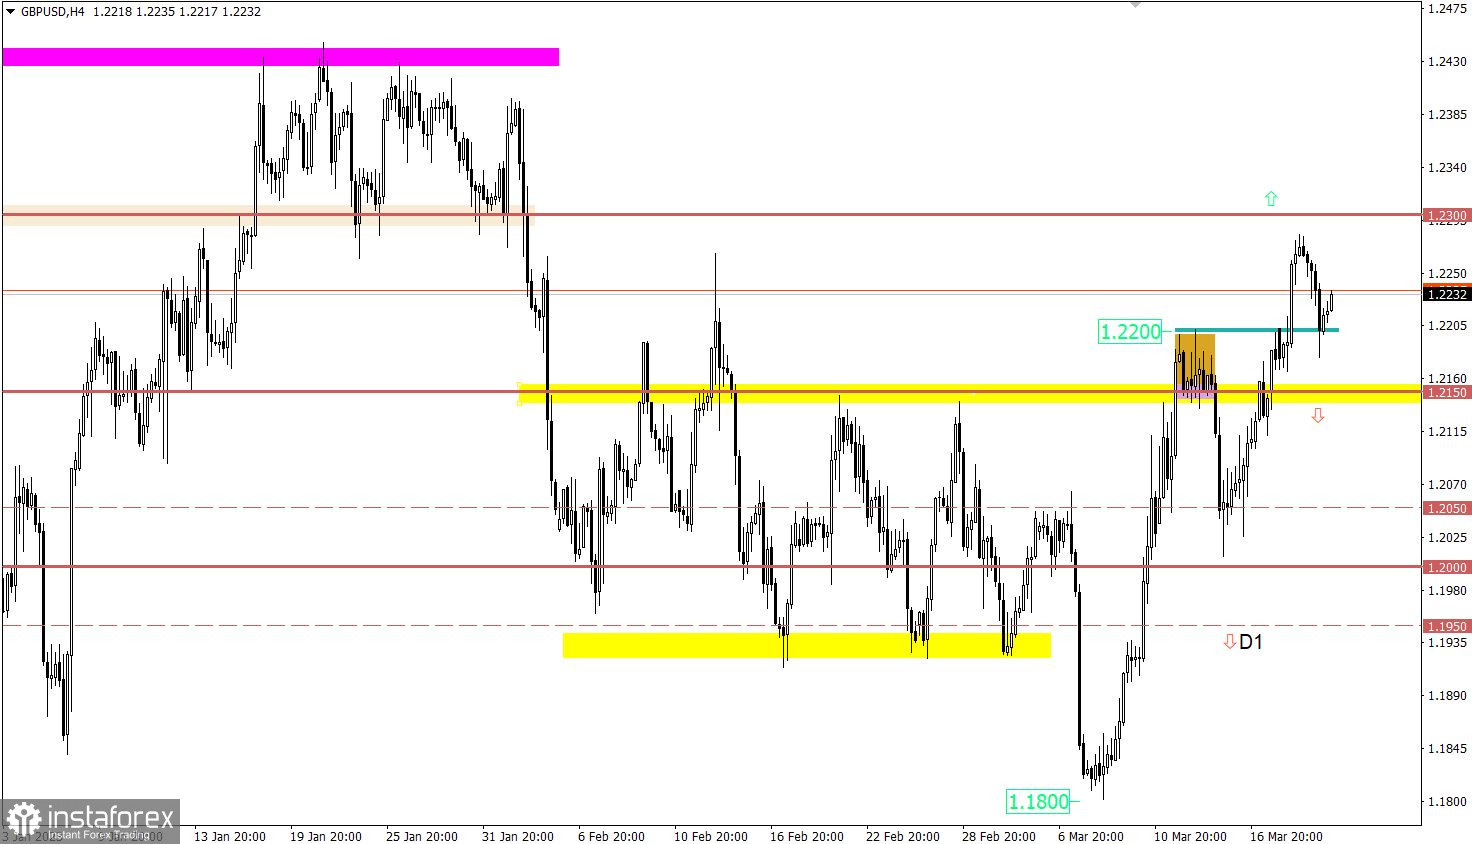
After reaching the 1.2300 resistance level, GBP/USD returned to the previously passed level of 1.2200. This pullback may be a period of regrouping of trading forces, where the level of 1.2200 acts as support.

The U.S. Federal Reserve is holding its March meeting amid increasing uncertainty caused by high inflation, low unemployment and emerging problems in the banking sector. According to consensus forecasts, a 25 basis point rate hike is expected at the March 21–22 meeting. Futures quotes for the rate level indicate that traders consider about an 83% probability of such a decision.
Nevertheless, many economists, including representatives of large banks, express doubts about the rate hike and believe that the Fed will pause in March and take no action.
Such event will attract the attention of speculators, which is likely to lead to an increase in volatility in the financial markets.
The Fed's decision will be announced today at 18:00 UTC, simultaneously with the publication of updated macroeconomic forecasts. Powell's traditional press conference following the meeting will begin at 18:30 UTC.
Thus, the level of 1.0800 may act as resistance, which may lead to a reduction in the volume of long positions. However, if the price holds above this level for a four-hour period, a subsequent rise can be expected with a high probability.
The situation has already resulted in a reduction of short positions in the pound sterling, within the range of 1.2200. This led to a slowing down of the pullback stage. In order for there to be a subsequent signal of the restoration of the pound rate relative to the decline in February, the quote needs to hold above the 1.2300 resistance level for at least a four-hour period. Otherwise, the current pullback will persist in the market, returning the quote below 1.2150.
The candlestick chart type is white and black graphic rectangles with lines above and below. With a detailed analysis of each individual candle, you can see its characteristics relative to a particular time frame: opening price, closing price, intraday high and low.
Horizontal levels are price coordinates, relative to which a price may stop or reverse its trajectory. In the market, these levels are called support and resistance.
Circles and rectangles are highlighted examples where the price reversed in history. This color highlighting indicates horizontal lines that may put pressure on the asset's price in the future.
The up/down arrows are landmarks of the possible price direction in the future.
Le recensioni analitiche di InstaForex ti renderanno pienamente consapevole delle tendenze del mercato! Essendo un cliente InstaForex, ti viene fornito un gran numero di servizi gratuiti per il trading efficiente.


