 Rimani
Condizioni di trading
Strumenti


In March of this year, the consumer confidence index in the United States increased and reached 104.2 points, which is higher than the revised figure of the previous month, equal to 103.4 points. It is noted that experts estimated a decline in the index to 101 points.
At the same time, the S&P CoreLogic Case-Shiller 20-city home price index rose 2.5% in January this year compared to last year. This growth rate was less than in December, when the index increased by 4.6%, and was the lowest since November 2019. Month-on-month, the index is decreasing by 0.6%.
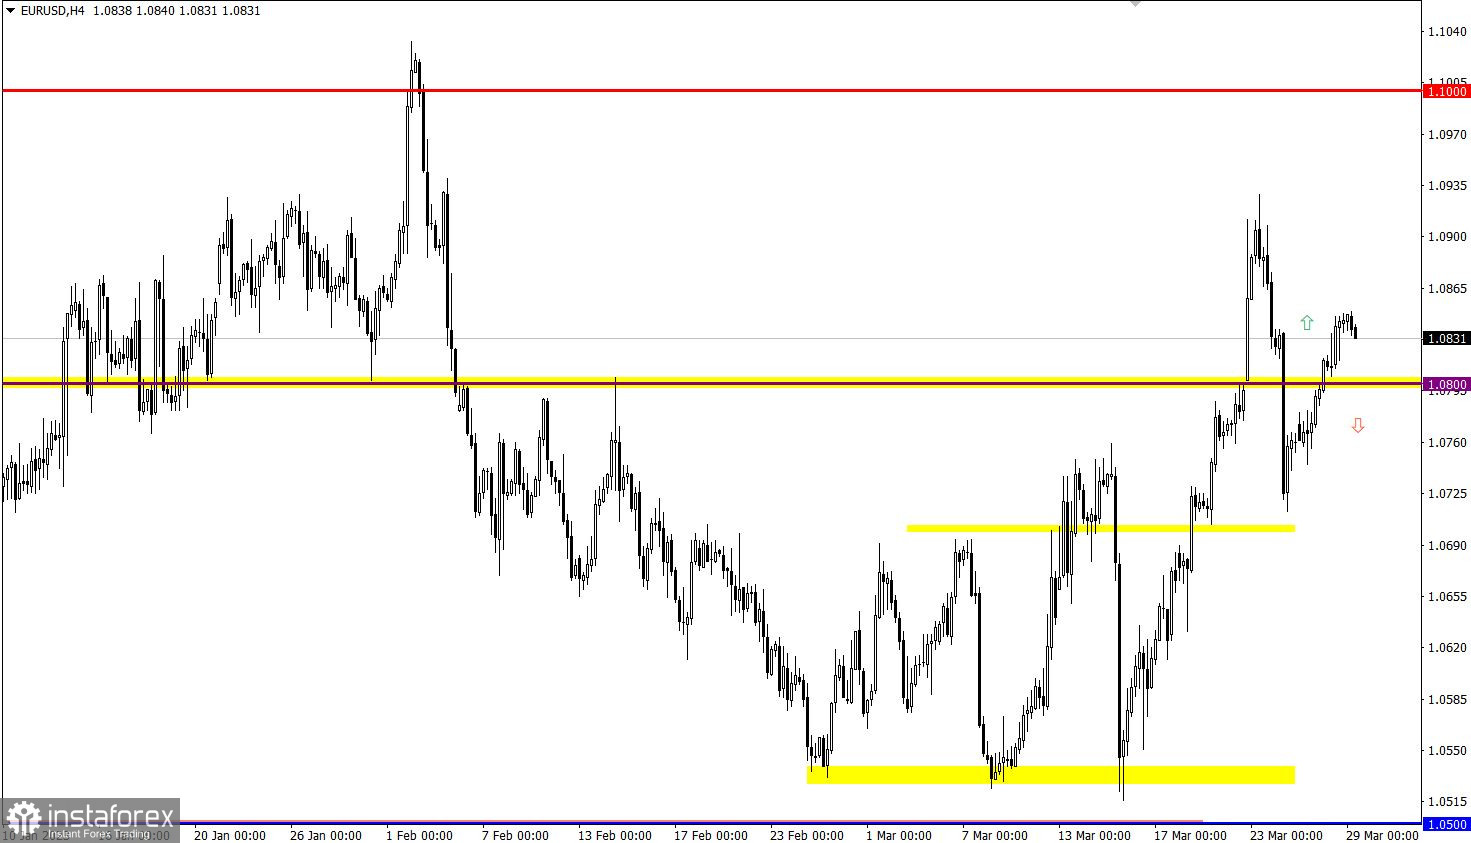
EUR/USD continues to rise after holding the price above 1.0800. Although the euro has been strengthening for two trading days in a row, it still has not fully recovered from its recent fall. However, the return of the price above 1.0800 indicates an increase in the volume of long positions.
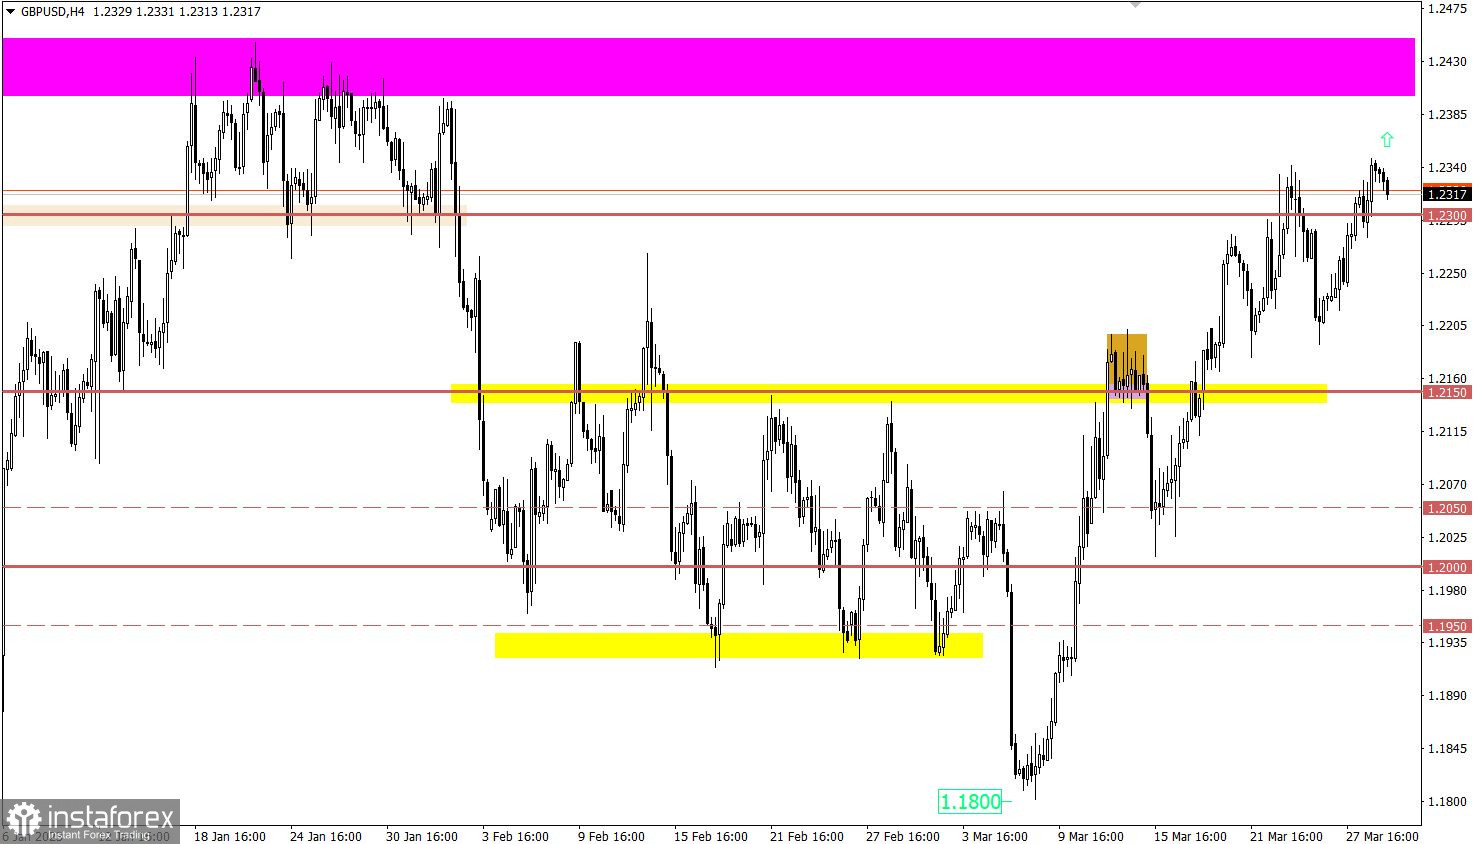
GBP/USD not only recovered its value after the recent decline, but also updated the local high of the previous week. This indicates the desire of buyers to continue to rise.

Today, data on the lending market in the UK is expected, and the forecasts are not encouraging. If forecasts and actual indicators coincide, the value of the pound sterling may be under pressure.
The number of approved mortgages could be 40.5k, up slightly from last month's 39.6k. This is the only positive in the forecasts. However, mortgage lending could fall to £3.7 billion, down from £4.1 billion in the previous month. Consumer lending could also fall to £1.3 billion, down from £1.6 billion. The volume of net loans to individuals is also declining.
Note that mortgage lending is directly related to the real estate market, which is an important sector of the British economy.
During the American trading session, the index of pending sales in the U.S. real estate market for February will be published, which is estimated to decline. This could negatively impact the economy.
Time targeting:
UK lending market – 08:30 UTC
U.S. Pending Home Sales Index – 14:00 UTC
If the rate holds above the level of 1.0800, further growth is possible with the update of the local high of the previous week. However, if the quote falls below 1.0800 and stays there within the day, this could lead to a new wave of decline.
If the price continues to hold steadily above 1.2350, it could lead to further growth in the volume of long positions. However it should be taken into account that the quote is already one step away from approaching the area of the local high of the medium-term upward trend, which is at 1.2400/1.2450. Thus, if growth continues, it will likely be limited.
The candlestick chart type is white and black graphic rectangles with lines above and below. With a detailed analysis of each individual candle, you can see its characteristics relative to a particular time frame: opening price, closing price, intraday high and low.
Horizontal levels are price coordinates, relative to which a price may stop or reverse its trajectory. In the market, these levels are called support and resistance.
Circles and rectangles are highlighted examples where the price reversed in history. This color highlighting indicates horizontal lines that may put pressure on the asset's price in the future.
The up/down arrows are landmarks of the possible price direction in the future.
Le recensioni analitiche di InstaForex ti renderanno pienamente consapevole delle tendenze del mercato! Essendo un cliente InstaForex, ti viene fornito un gran numero di servizi gratuiti per il trading efficiente.


