 Rimani
Condizioni di trading
Strumenti

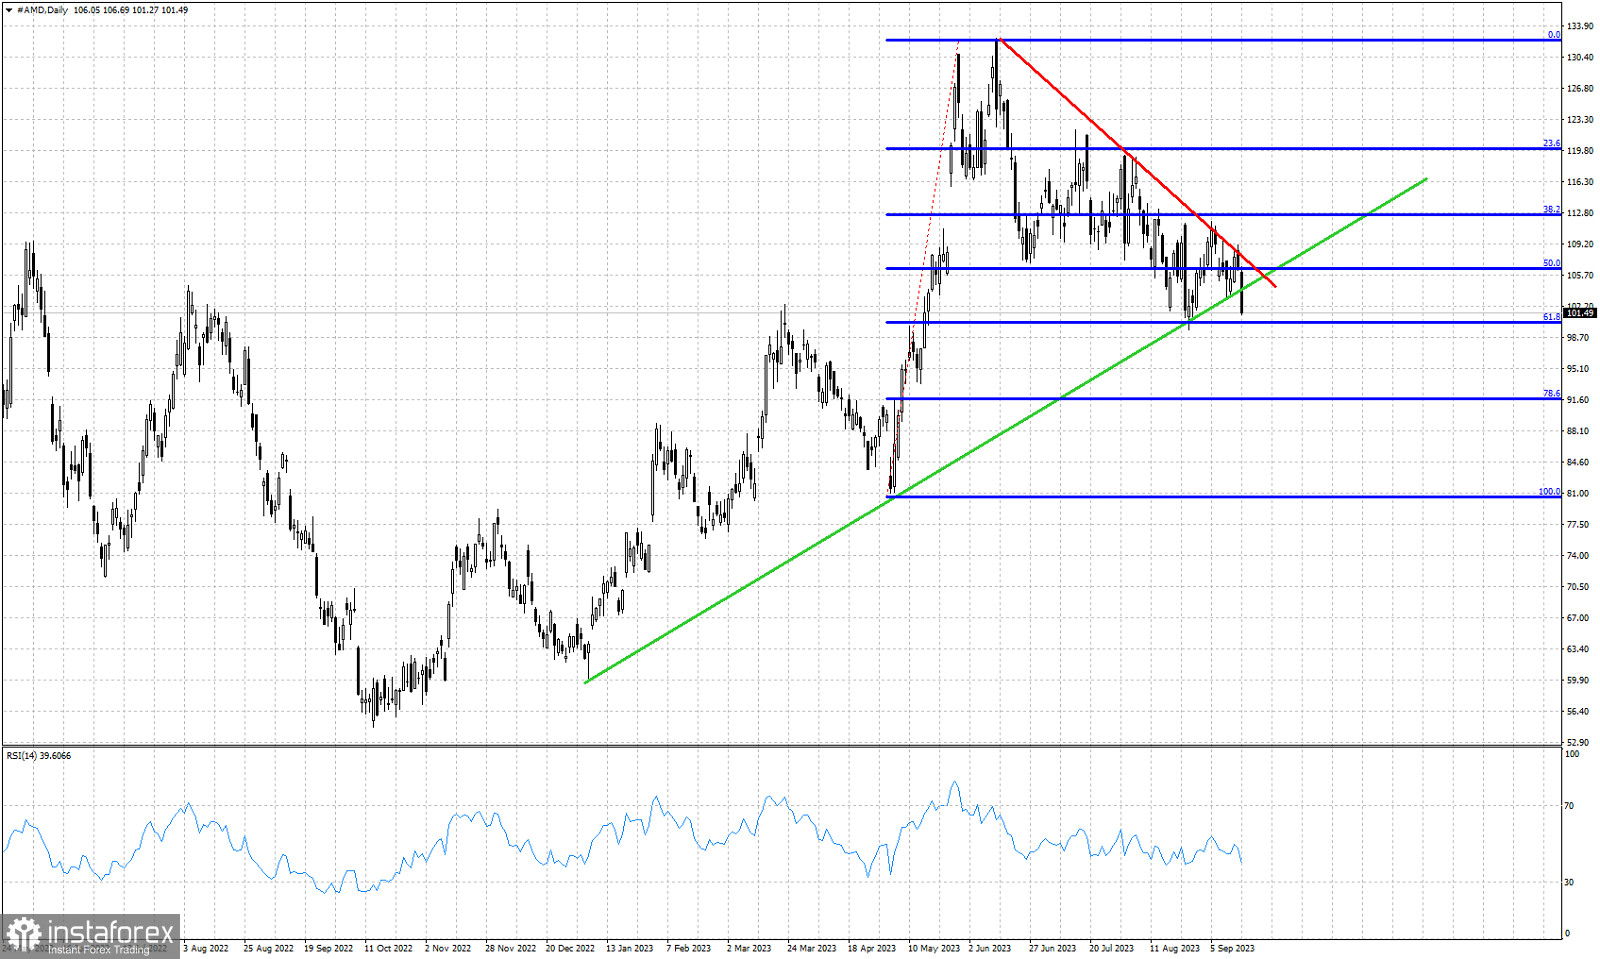
Green line- support trend line
Red line- resistance trend line
Blue lines -Fibonacci retracements
By the end of the previous week, AMD stock price closed around $101.50 breaking below the green upward sloping support trend line. Last week price got rejected at the red downward sloping resistance trend line. Price is now challenging once again the 61.8% Fibonacci retracement. The 61.8% Fibonacci retracement level provides support at $100.20. A break below this level will strengthen the bearish signal from last week. Next downside target will be at $91.50 if support at $100 fails to hold. Bulls need to push price above $107-108 in order to reclaim control of the short-term trend. AMD stock price is vulnerable to the downside as long as price holds below the $108 level.
Le recensioni analitiche di InstaForex ti renderanno pienamente consapevole delle tendenze del mercato! Essendo un cliente InstaForex, ti viene fornito un gran numero di servizi gratuiti per il trading efficiente.


