 Rimani
Condizioni di trading
Strumenti


Technical Market Outlook:
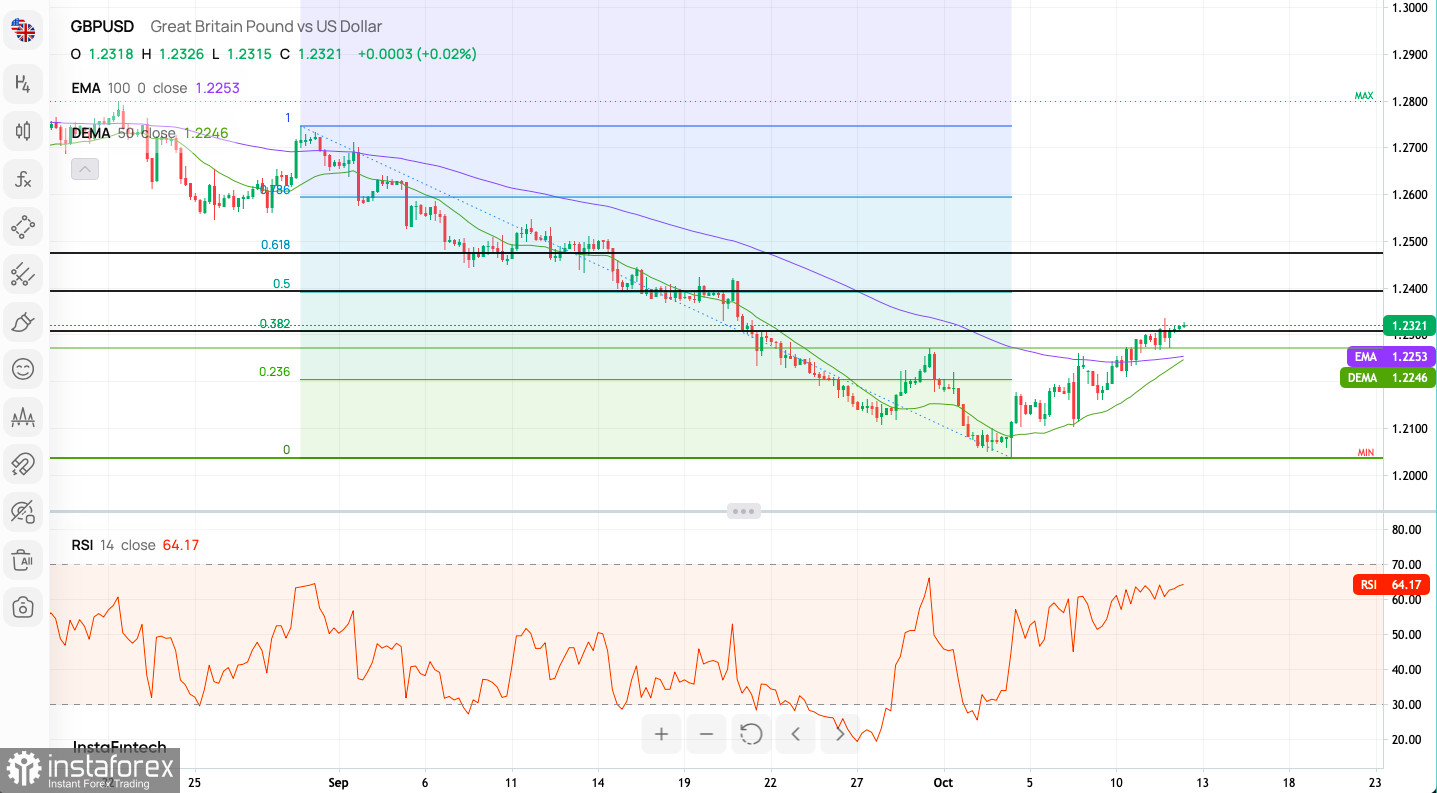
The GBP/USD pair has been seen continuing the pull-back above the last swing high located at the level of 1.2271 and made a new swing high at the level of 1.2303. Only a strong and sustained breakout above this level would change the current situation to more bullish, but for now all the bullish attempts to extend the up move are in vain. The intraday technical support is located at the level of 1.2260 and the intraday technical resistance is seen at 1.2303. Please notice, that despite the possible pull-back, the mid-term outlook remains bearish due to the Bearish Cross of 50 and 100 DMA on the daily time frame chart.
Weekly Pivot Points:
WR3 - 1.22927
WR2 - 1.22441
WR1 - 1.22152
Weekly Pivot - 1.21955
WS1 - 1.21666
WS2 - 1.21469
WS3 - 1.20983
Trading Outlook:
The bulls were rejected at the key technical resistance located at the level of 1.3163 and a breakout above this level is needed to extend the up trend towards the last Weekly swing high seen at 1.4248. The weekly time frame chart shows the Bearish Engulfing candlestick pattern was made during the breakout attempt above the 1.3163, so now the bears are in charge of the market. Any sustained breakout below the technical support seen at the level of 1.1802 would dramatically increase the chances of another leg down towards the level of 1.1494.
Le recensioni analitiche di InstaForex ti renderanno pienamente consapevole delle tendenze del mercato! Essendo un cliente InstaForex, ti viene fornito un gran numero di servizi gratuiti per il trading efficiente.


