 Rimani
Condizioni di trading
Strumenti


The second estimate of U.S. GDP data for the first quarter were published yesterday, surpassing analysts' forecasts. The U.S. economy saw a growth rate of 1.3% annually, while a growth rate of 1.1% was expected. This positive report led to further strengthening of the overbought dollar.
At the same time as the GDP data release, weekly figures for U.S. jobless claims were published, which turned out to be better than expected. The number of continuing claims fell from 1.799 million to 1.794 million, while the number of initial claims rose from 225,000 to 229,000, with an expected increase to 245,000.
These data confirmed the strengthening of the already overbought U.S. dollar in the market.
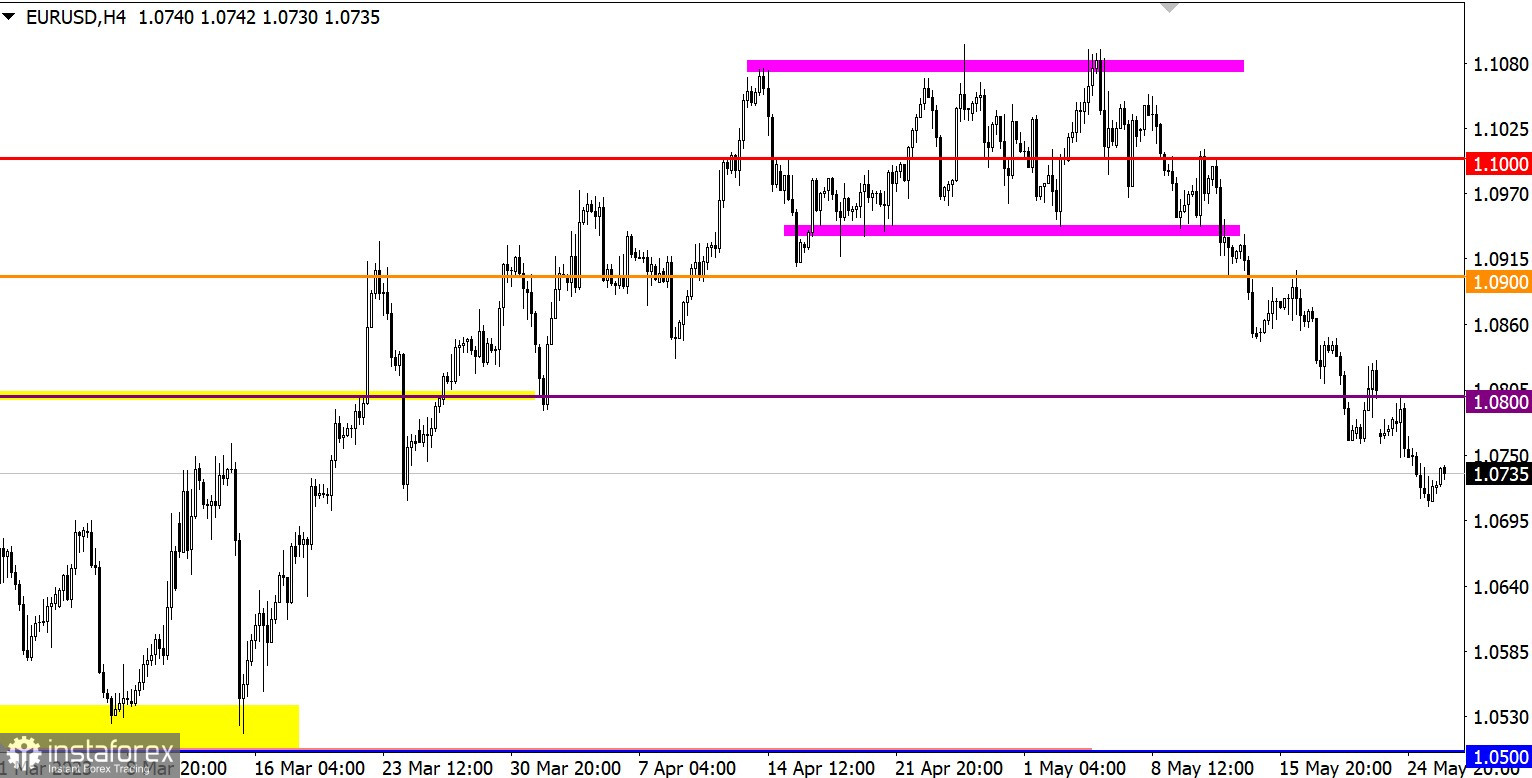
EUR/USD exchange rate continues to decline, reaching levels seen in March of this year. This intense movement is characterized as inertial and disregards numerous technical signals in the market.
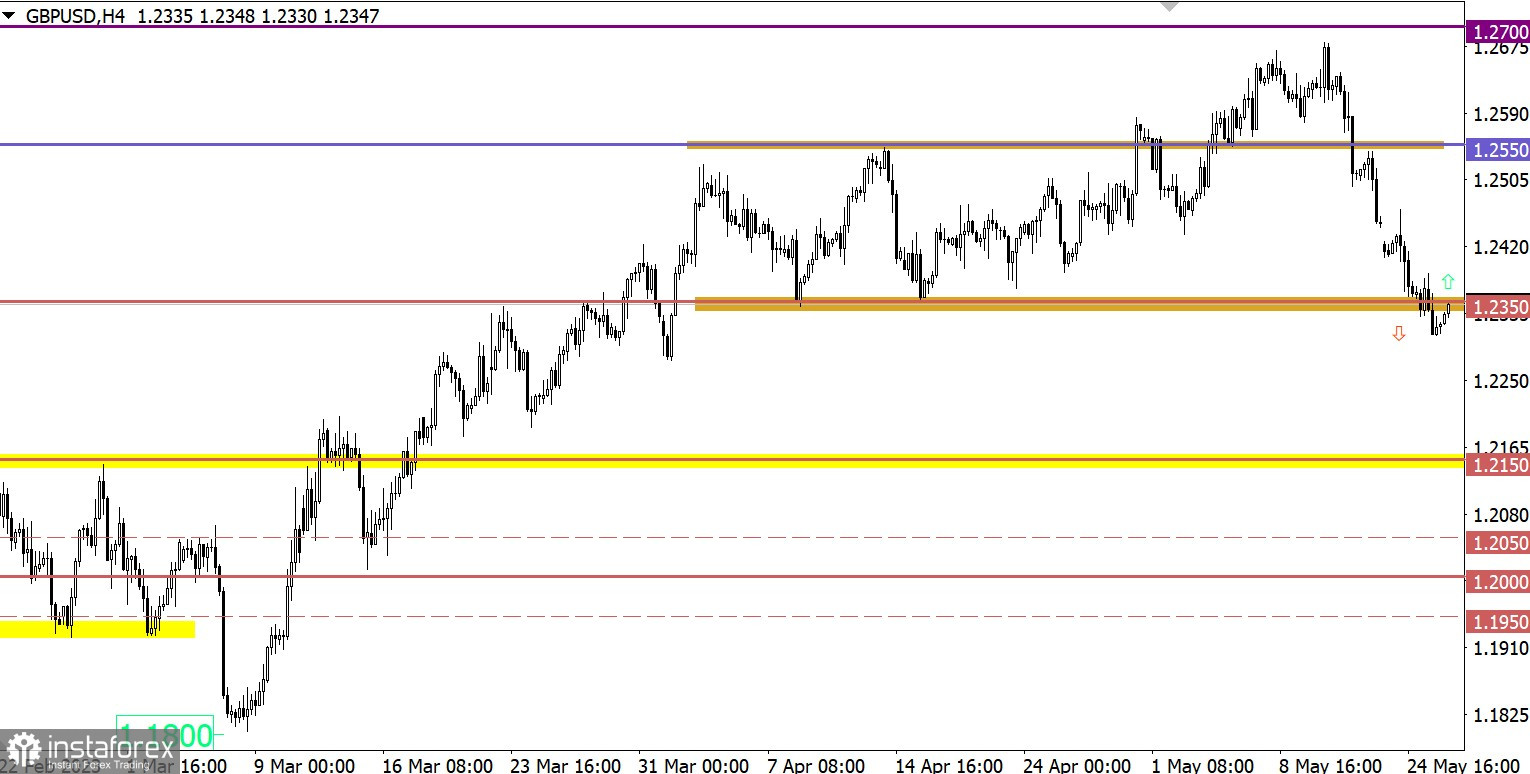
GBP/USD also continues its downward movement, surpassing the level of 1.2350. This significant price change has triggered a technical signal of oversold pound sterling.
Retail sales data for the UK were published at the opening of the European session, showing a slowdown in the decline from -3.9% to -3.0% year-on-year, which was noticeably worse than the forecast—the rate of decline was expected to slow down to 2.6%. However, this was still enough for at least a symbolic increase in the pound sterling.
Due to the overbought short positions on the euro, a full-blown technical correction may occur in the market, leading the price back to the level of 1.0800. However, as mentioned earlier, speculators are ignoring the technical signal of oversold euro and overbought U.S. dollar. Therefore, holding the price below the level of 1.0700 may lead to continued inertial movement.
Based on the overbought short positions, it is reasonable to assume a possible transition to a counteracting retracement phase against the current inertia. However, as noted in the case of the EUR/USD pair, speculators have been ignoring technical signals lately. For this reason, holding the price below the value of 1.2300 may lead to subsequent decline.
The candlestick chart type is white and black graphic rectangles with lines above and below. With a detailed analysis of each individual candle, you can see its characteristics relative to a particular time frame: opening price, closing price, intraday high and low.
Horizontal levels are price coordinates, relative to which a price may stop or reverse its trajectory. In the market, these levels are called support and resistance.
Circles and rectangles are highlighted examples where the price reversed in history. This color highlighting indicates horizontal lines that may put pressure on the asset's price in the future.
The up/down arrows are landmarks of the possible price direction in the future.
Le recensioni analitiche di InstaForex ti renderanno pienamente consapevole delle tendenze del mercato! Essendo un cliente InstaForex, ti viene fornito un gran numero di servizi gratuiti per il trading efficiente.


