 Rimani
Condizioni di trading
Strumenti


The EUR/USD pair slightly fell for most of Monday, extending Friday's movement. Throughout the day, there were several economic reports, all of which were PMIs. We previously highlighted the importance of the ISM index in the US. Interestingly enough, this index was the only one that provoked a market reaction. However, its value wasn't exactly disappointing. The index declined in May, but the fall was not crucial. The market likely reacted to the fact that the value was close to the "waterline" of 50.3. This means that in the coming months, the index may drop below this level, indicating a negative trend in both key areas. Thus, the euro unexpectedly found support on Monday. At the moment, it is still unclear whether the pair will resume its downtrend or form a new uptrend.
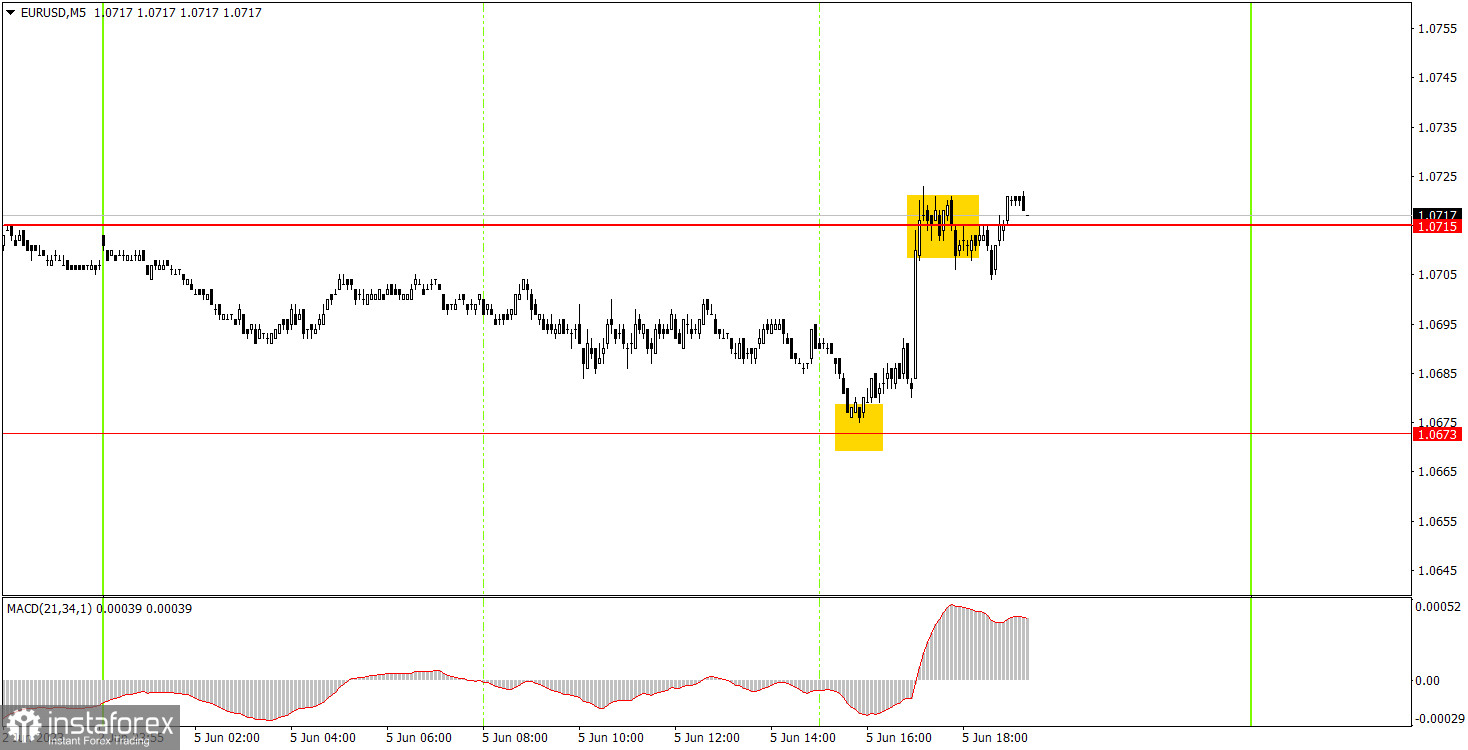
The 5-minute chart shows that there was virtually no movement during the Asian and European trading sessions. Then the US session opened and the pair fell to 1.0673 and quickly bounced off it, forming a buy signal. Consequently, beginners could have opened long positions, and a few hours later, the price reached the area around 1.0715, where the trade could be closed with a profit of about 20 pips. Despite the sharp growth in the second half of the day, overall volatility remained relatively weak, with only 47 pips. Therefore, it was quite challenging to expect significant profits on Monday.
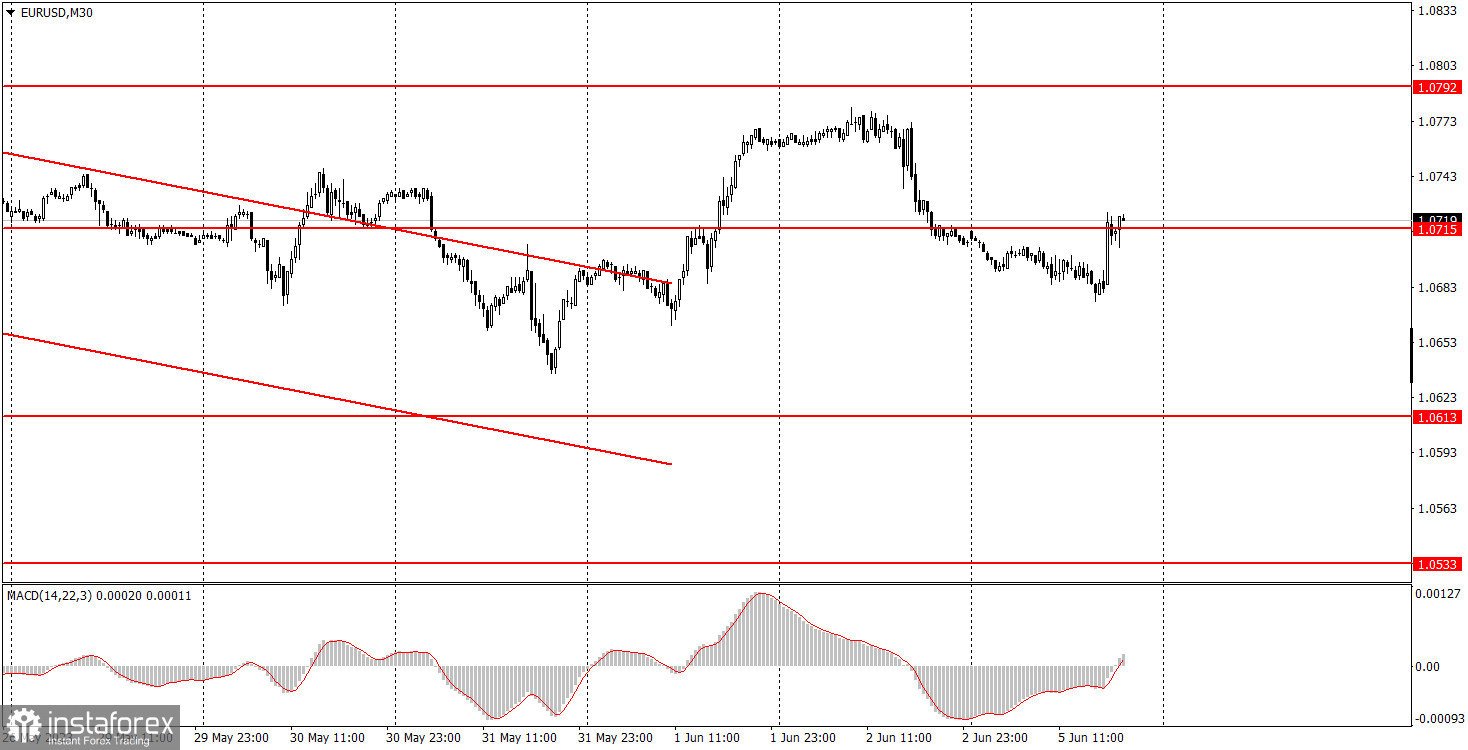
The 30M chart shows that the pair intends to end the downtrend. The price has left the descending channel, indicating that the euro may rise for some time, but in the medium-term perspective, we still expect a decline. The key levels on the 5M chart are 1.0517-1.0533, 1.0607-1.0613, 1.0673, 1.0715, 1.0761, 1.0792, 1.0857-1.0867. A stop loss can be set at a breakeven point as soon as the price moves 15 pips in the right direction. The EU will release its retail sales report on Tuesday, while there will be no significant reports in the US. Therefore, there is a high probability of another low-volatility and uneventful day. The entire current week may turn out this way, as the fundamental and macroeconomic backgrounds are expected to be weak.
1) The strength of the signal depends on the time period during which the signal was formed (a rebound or a break). The shorter this period, the stronger the signal.
2) If two or more trades were opened at some level following false signals, i.e. those signals that did not lead the price to Take Profit level or the nearest target levels, then any consequent signals near this level should be ignored.
3) During the flat trend, any currency pair may form a lot of false signals or do not produce any signals at all. In any case, the flat trend is not the best condition for trading.
4) Trades are opened in the time period between the beginning of the European session and until the middle of the American one when all deals should be closed manually.
5) We can pay attention to the MACD signals in the 30M time frame only if there is good volatility and a definite trend confirmed by a trend line or a trend channel.
6) If two key levels are too close to each other (about 5-15 pips), then this is a support or resistance area.
Support and Resistance price levels can serve as targets when buying or selling. You can place Take Profit levels near them.
Red lines are channels or trend lines that display the current trend and show which direction is better to trade.
MACD indicator (14,22,3) is a histogram and a signal line showing when it is better to enter the market when they cross. This indicator is better to be used in combination with trend channels or trend lines.
Important speeches and reports that are always reflected in the economic calendars can greatly influence the movement of a currency pair. Therefore, during such events, it is recommended to trade as carefully as possible or exit the market in order to avoid a sharp price reversal against the previous movement.
Beginners should remember that every trade cannot be profitable. The development of a reliable strategy and money management are the key to success in trading over a long period of time.
Le recensioni analitiche di InstaForex ti renderanno pienamente consapevole delle tendenze del mercato! Essendo un cliente InstaForex, ti viene fornito un gran numero di servizi gratuiti per il trading efficiente.

