 Rimani
Condizioni di trading
Strumenti


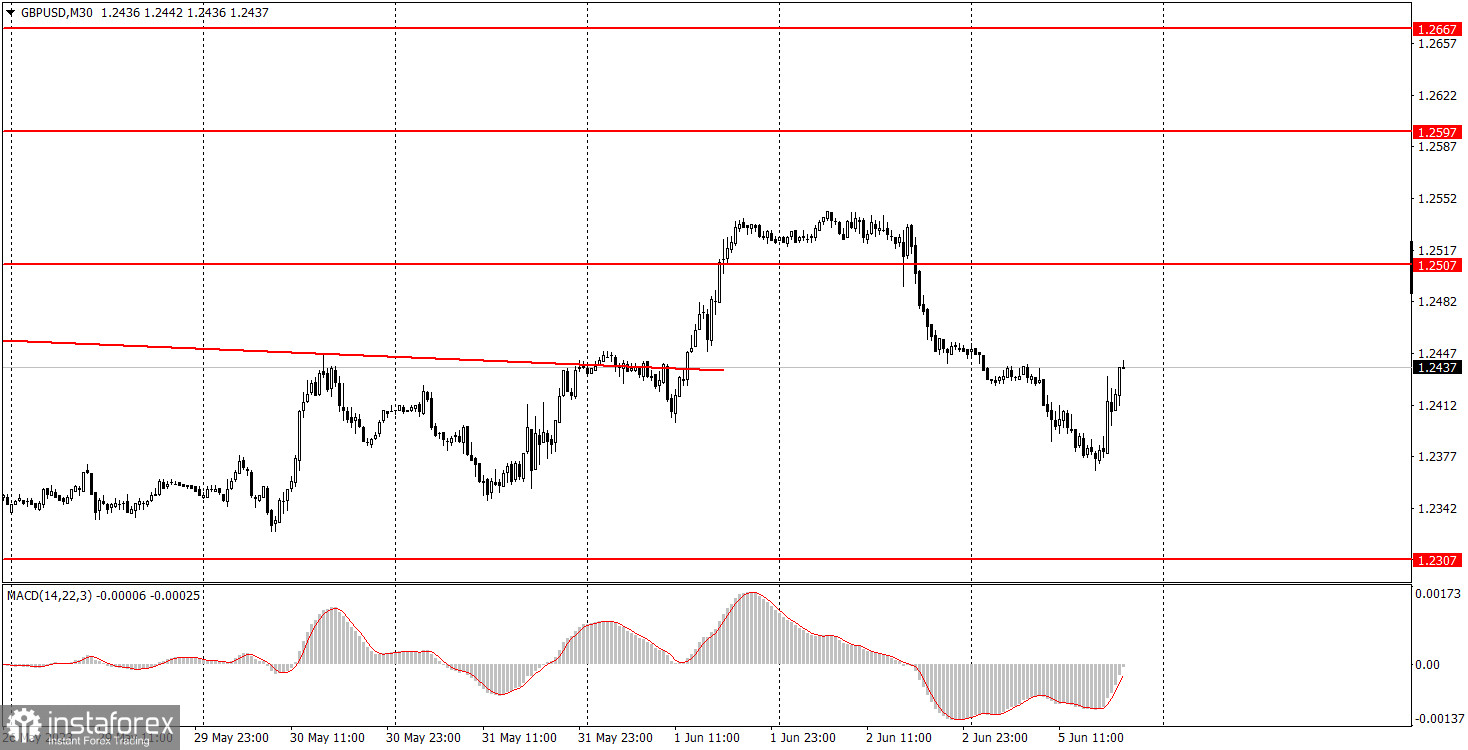
The GBP/USD pair traded lower for most of Monday, clearly indicating a desire to resume its downtrend. However, the US ISM services index spoiled the bearish sentiment. It's worth noting that volatility reached 84 pips, nearly double that of the euro. Therefore, you could trade the pound, and we will discuss the signals in more detail below. For now, I should mention that the downtrend has been broken as the pair recently crossed two descending trendlines. From a technical perspective, a short-term rise is possible, but from the same technical standpoint, a decline should be expected in the medium term. The current situation is not entirely clear, and this week's fundamental and macroeconomic backdrop is unlikely to help.
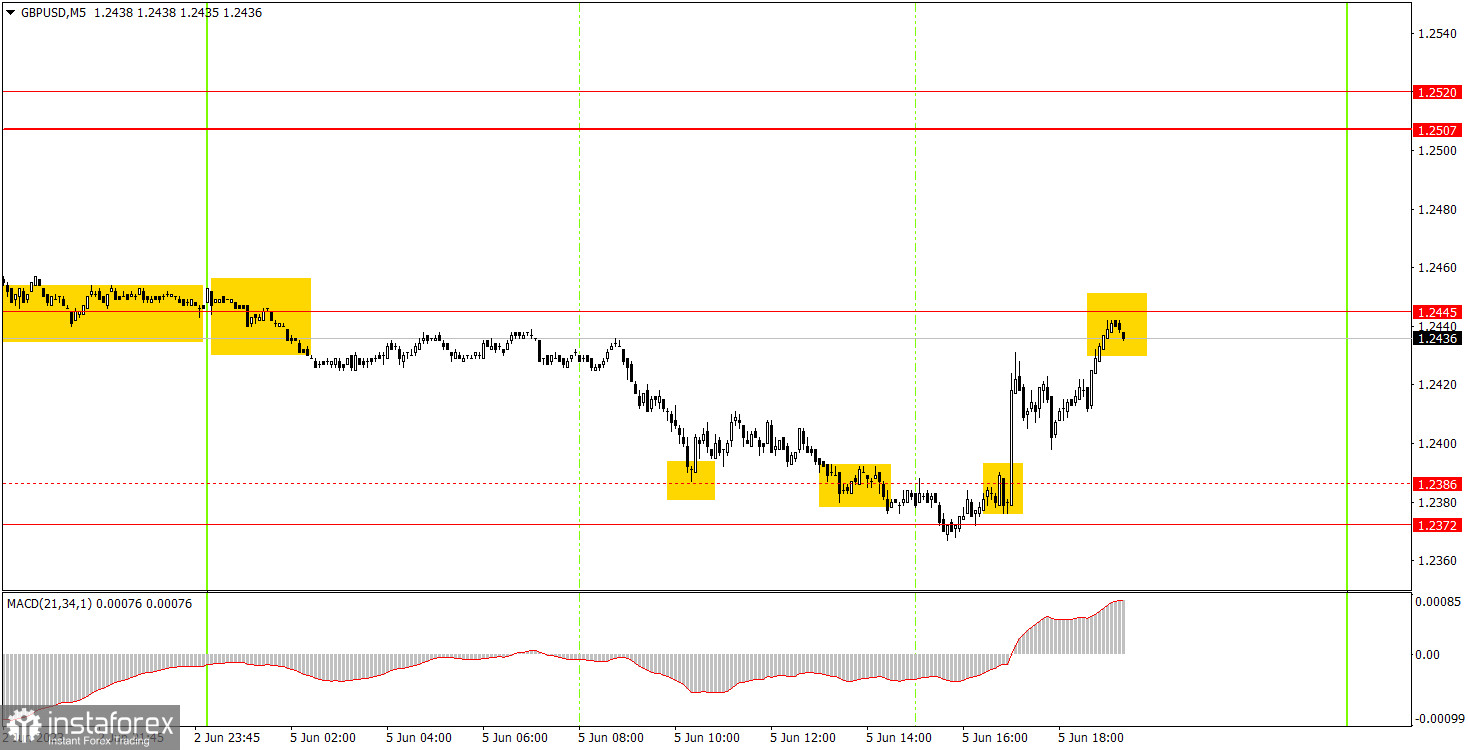
There were some trading signals on the 5-minute chart, although they weren't great. The first sell signal was formed overnight, but by the opening of the European session, the pair was at the point of formation. Therefore, you could have confidently opened a short position. Later, the price dropped to the level of 1.2386 and bounced off it. It was appropriate to close the shorts (with a profit of about 25 pips) and open longs. The buy signal turned out to be false, as did the subsequent sell signal. These two signals "ate up" all the profit from the first trade and we were forced to remove the level of 1.2386 and replace it with 1.2372. It was not advisable to trade the last signal around 1.2372 as the first two proved to be false.
As seen on the 30M chart, the GBP/USD pair has ended its downtrend and started a new uptrend in the short-term. We believe that the pound has not fallen enough to form a new strong uptrend, but the market may have a different opinion. There are a couple of important data scheduled for release this week, so we recommend analyzing higher charts to understand the potential direction of the price. The key levels on the 5M chart are .2171-1.2179, 1.2245, 1.2307, 1.2372, 1.2445, 1.2507-1.2520, 1.2597-1.2616, 1.2659, 1.2697. When the price moves 20 pips in the right direction after opening a trade, a stop loss can be set at breakeven. The UK will release its Construction PMI on Tuesday, which could potentially provoke a market reaction. However, the chances of that are still low. The economic calendar is empty in the US.
1) The strength of the signal depends on the time period during which the signal was formed (a rebound or a break). The shorter this period, the stronger the signal.
2) If two or more trades were opened at some level following false signals, i.e. those signals that did not lead the price to Take Profit level or the nearest target levels, then any consequent signals near this level should be ignored.
3) During the flat trend, any currency pair may form a lot of false signals or do not produce any signals at all. In any case, the flat trend is not the best condition for trading.
4) Trades are opened in the time period between the beginning of the European session and until the middle of the American one when all deals should be closed manually.
5) We can pay attention to the MACD signals in the 30M time frame only if there is good volatility and a definite trend confirmed by a trend line or a trend channel.
6) If two key levels are too close to each other (about 5-15 pips), then this is a support or resistance area.
Support and Resistance price levels can serve as targets when buying or selling. You can place Take Profit levels near them.
Red lines are channels or trend lines that display the current trend and show which direction is better to trade.
MACD indicator (14,22,3) is a histogram and a signal line showing when it is better to enter the market when they cross. This indicator is better to be used in combination with trend channels or trend lines.
Important speeches and reports that are always reflected in the economic calendars can greatly influence the movement of a currency pair. Therefore, during such events, it is recommended to trade as carefully as possible or exit the market in order to avoid a sharp price reversal against the previous movement.
Beginners should remember that every trade cannot be profitable. The development of a reliable strategy and money management are the key to success in trading over a long period of time.
Le recensioni analitiche di InstaForex ti renderanno pienamente consapevole delle tendenze del mercato! Essendo un cliente InstaForex, ti viene fornito un gran numero di servizi gratuiti per il trading efficiente.


