 Rimani
Condizioni di trading
Strumenti


As we delve into the Bitcoin (BTC) market's current landscape, the technicals on the 4-hour chart present a compelling narrative for traders and investors alike. With an uptrend clearly in view, let's unpack the key indicators and patterns that could shape the near-term trajectory of this cryptocurrency.
The Bitcoin market is showing signs of a bullish stance, bolstered by recent technical analysis and sentiment indicators. This analysis incorporates pivotal data points including weekly pivot points, trading outlook, intraday indicator signals, and sentiment scores, presenting a comprehensive view of Bitcoin's potential trajectory.
The first thing to note is the upward trend indicated by the higher lows and higher highs, a classic sign of bullish momentum. The support trend line, drawn from the ascending lows, has been a reliable springboard for price rebounds, while the resistance level, a horizontal line marking previous highs, is the immediate barrier bulls must overcome.
Our chart showcases several notable candlestick formations:
Both the Exponential Moving Average (EMA) and the Double Exponential Moving Average (DEMA) are trending upwards and sit below the current price, reinforcing the strength of the uptrend. A sustained position above these lines typically conveys bullish sentiment among market participants.
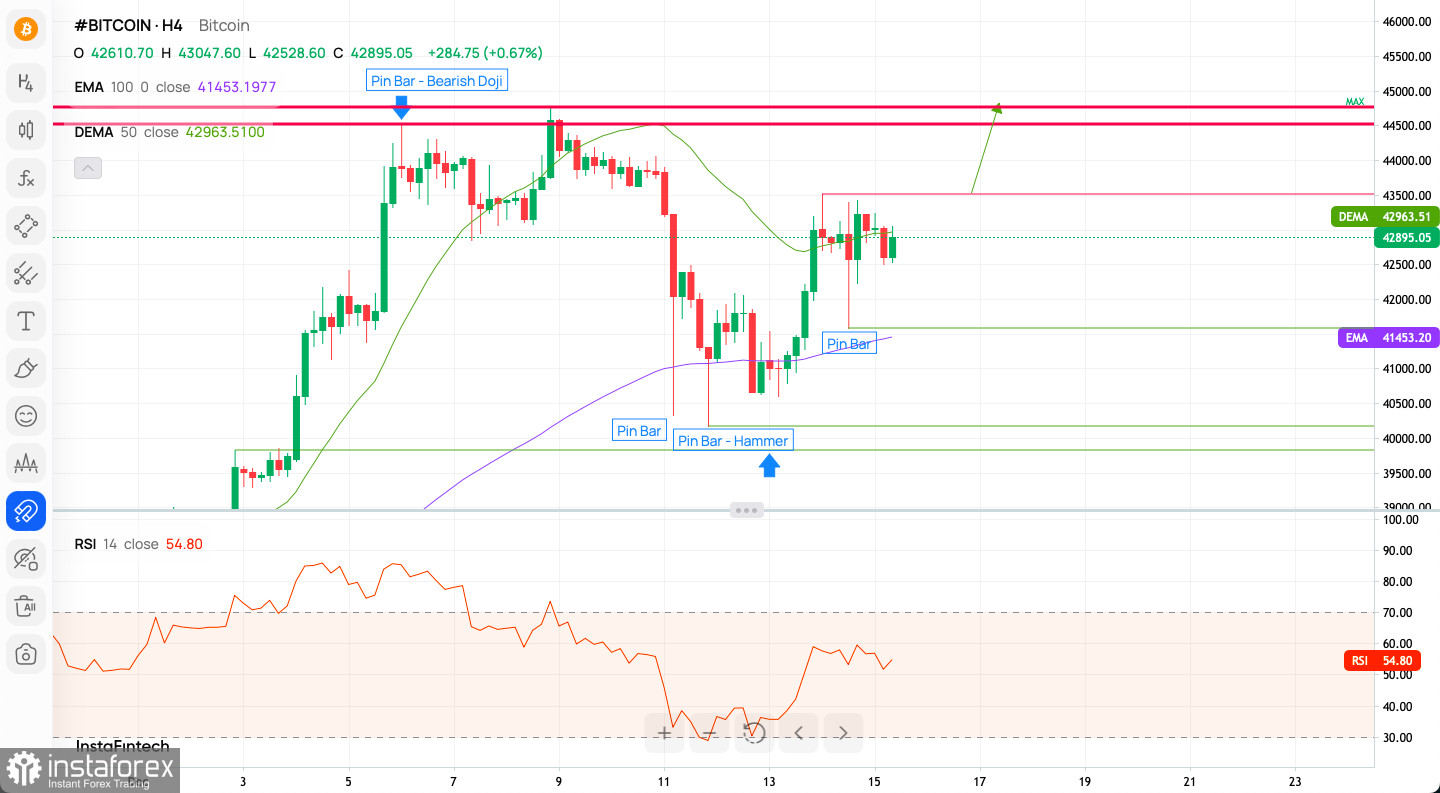
The Relative Strength Index (RSI) is currently at a comfortable 54.80, avoiding the overbought or oversold territories. This equilibrium suggests that Bitcoin has some room for movement before encountering the overextension risks often associated with RSI extremes.
Pivot points serve as critical indicators for potential trend reversals and key support and resistance levels. This week's pivot data lays out several noteworthy thresholds:
These levels offer strategic insights for traders, marking potential targets and turnaround zones.
With the bulls eyeing $48,200 as the next long-term target, the trajectory appears to favor an extended uptrend, contingent upon holding above the critical threshold of $19,572. Moreover, the key long-term technical support levels are identified at $32,829 and $31,790, which, if maintained, further solidify the bullish scenario.
On the hourly chart, a strong consensus towards a bullish move is evident:
The sentiment scoreboard mirrors the technical indicators, with a pronounced bullish inclination:
When we stitch together the pivot point data with the trading outlook, intraday signals, and sentiment scores, the picture is one of cautious optimism. The technicals suggest that if Bitcoin can sustain its foothold above the weekly pivot and key support levels, there's a clear path to upward movement, with the sights set on the resistance levels, particularly the ambitious WR3.
However, traders should note the importance of these levels as potential inflection points, where the market sentiment and price action could pivot, influenced by external factors and market dynamics.
The overall market sentiment and technical indicators for Bitcoin indicate a strong bullish bias. The detailed analysis of pivot points complements this outlook, providing traders with a roadmap of critical price levels to watch. As the sentiment remains favorable, the onus is on maintaining key support levels to sustain the upward momentum.
The technical outlook for Bitcoin is cautiously optimistic. The key will be the market's reaction at the resistance level; a convincing breach could pave the way for new highs, whereas a rejection might lead to consolidation or a pullback.
The begginers in forex trading need to be very careful when making decisions about entering the market. Before the release of important reports, it is best to stay out of the market to avoid being caught in sharp market fluctuations due to increased volatility. If you decide to trade during the news release, then always place stop orders to minimize losses.
Without placing stop orders, you can very quickly lose your entire deposit, especially if you do not use money management and trade large volumes. For successful trading, you need to have a clear trading plan and stay focues and disciplined. Spontaneous trading decision based on the current market situation is an inherently losing strategy for a scalper or daytrader.
Le recensioni analitiche di InstaForex ti renderanno pienamente consapevole delle tendenze del mercato! Essendo un cliente InstaForex, ti viene fornito un gran numero di servizi gratuiti per il trading efficiente.


