 Rimani
Condizioni di trading
Strumenti


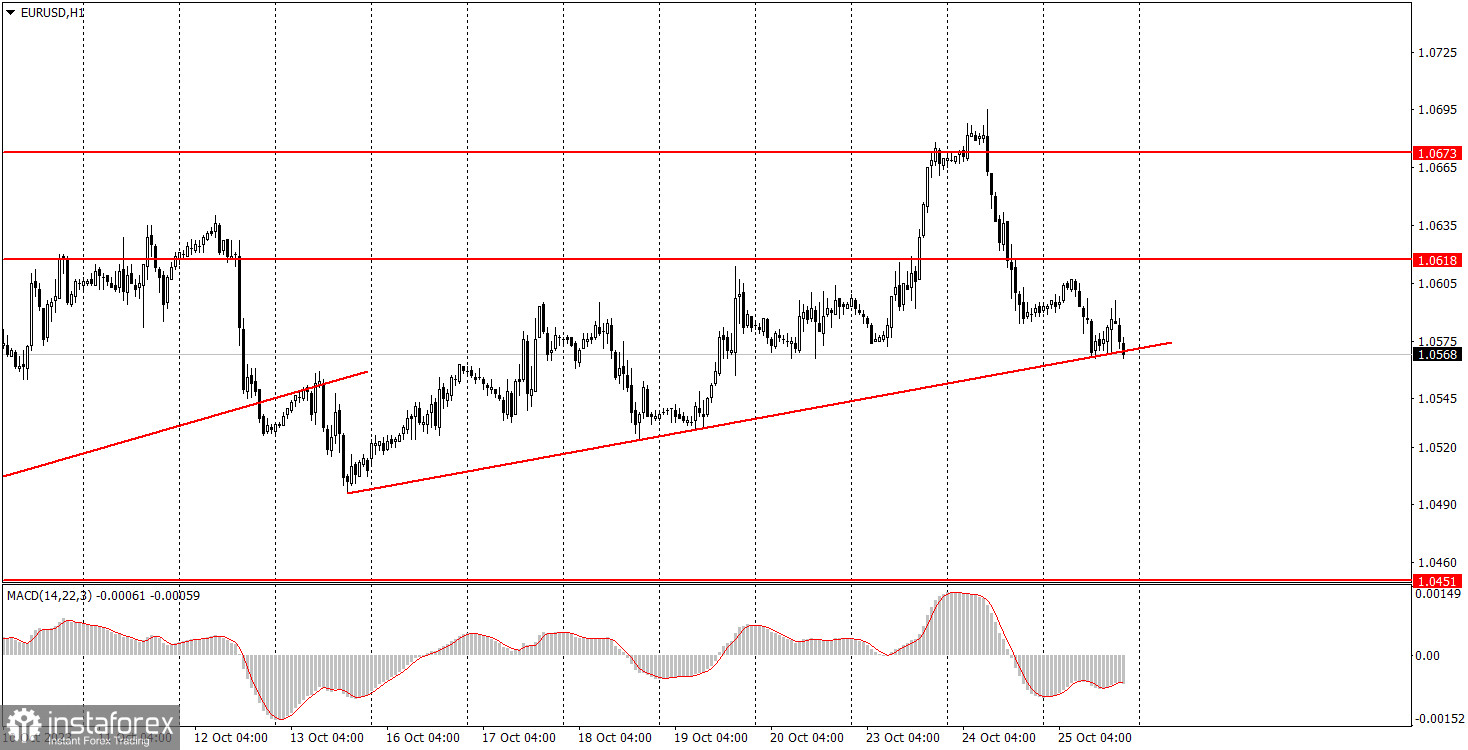
EUR/USD dropped for the second consecutive day, and by the end of Wednesday, it fell to the ascending trendline. The euro's fate for the next few days, and possibly weeks, will be determined in the coming hours. If the pair breaches the trendline, there is a high chance that the euro will continue to fall to the 1.0451 target. If not, we might witness a new upward movement in the corrective phase.
There were hardly any economic reports on Wednesday. The US published a report on new home sales, which had no impact on the pair's movement. European Central Bank President Christine Lagarde did not provide any new information, and Federal Reserve Chairman Jerome Powell's speech had not even started when this article was written. As a result, it was an entirely uneventful day, and volatility was low again, just 43 pips. There is not much to discuss with such low volatility.
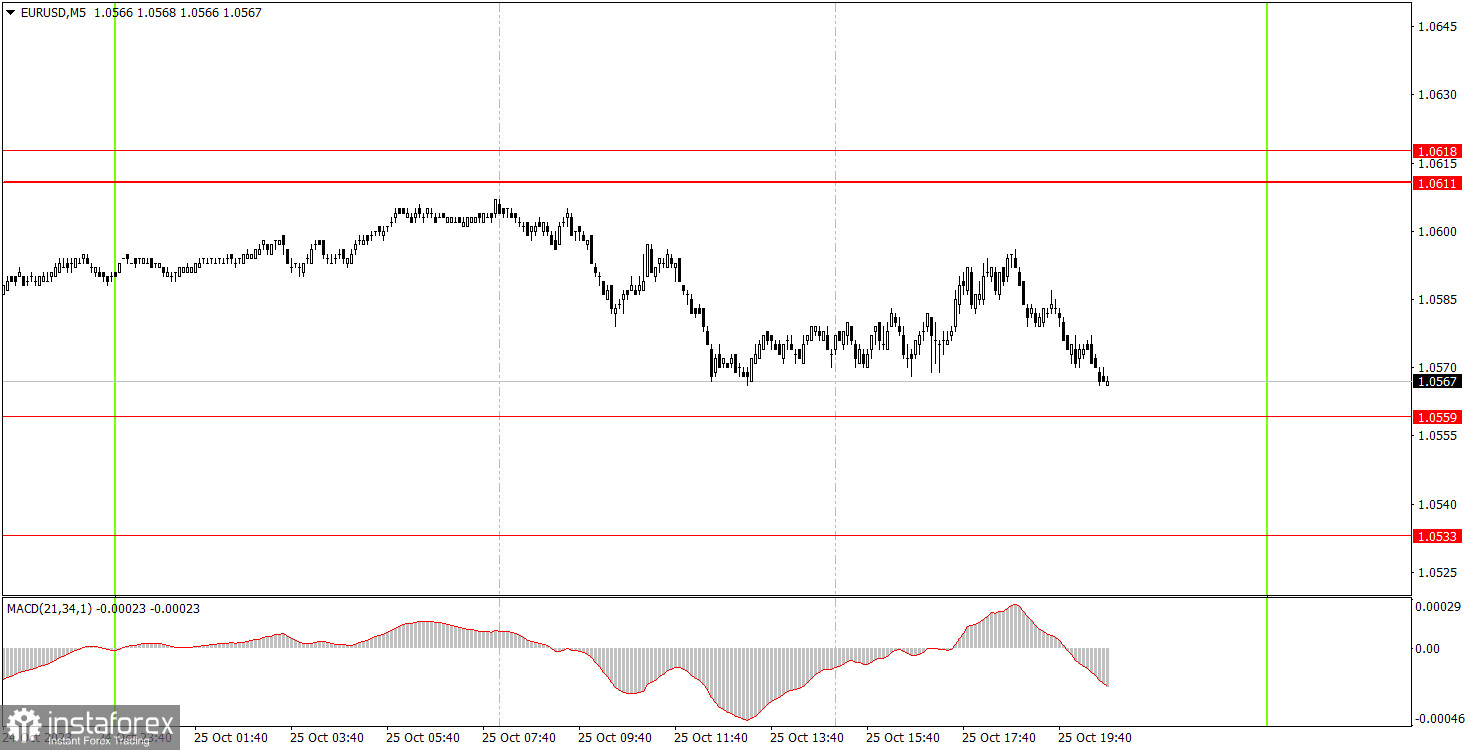
On the 5-minute chart, no trading signals were generated, and maybe this was a good thing. Since volatility was only 43 pips, there was basically no movement. And there was also a big possibility of encountering several false signals.
On the 30-minute chart, the pair continues its upward movement, which may be abrupt and unstable, representing a correction. We have repeatedly mentioned our expectation of a decline in the euro currency in the medium term, and it might already have started. We can confirm this once the pair breaches the trendline. The key levels on the 5M chart are 1.0391, 1.0433, 1.0451, 1.0483, 1.0533, 1.0559, 1.0611-1.0618, 1.0673, 1.0733, 1.0767-1.0781, 1.0835. A stop loss can be set at a breakeven point as soon as the price moves 15 pips in the right direction.
The ECB policy decision is due Thursday, and Lagarde's news conference follows a half hour later. Although no one is expecting any groundbreaking decisions from the central bank, market reactions to any decisions and statements can be significant. From the US, traders can focus on reports on the quarterly GDP and orders for durable goods, which could also have a substantial impact on the dollar's movement. Therefore, we can expect quite a volatile day.
1) Signal strength is determined by the time taken for its formation (either a bounce or level breach). A shorter formation time indicates a stronger signal.
2) If two or more trades around a certain level are initiated based on false signals, subsequent signals from that level should be disregarded.
3) In a flat market, any currency pair can produce multiple false signals or none at all. In any case, the flat trend is not the best condition for trading.
4) Trading activities are confined between the onset of the European session and mid-way through the U.S. session, post which all open trades should be manually closed.
5) On the 30-minute timeframe, trades based on MACD signals are only advisable amidst substantial volatility and an established trend, confirmed either by a trend line or trend channel.
6) If two levels lie closely together (ranging from 5 to 15 pips apart), they should be considered as a support or resistance zone.
Support and Resistance price levels can serve as targets when buying or selling. You can place Take Profit levels near them.
Red lines represent channels or trend lines, depicting the current market trend and indicating the preferable trading direction.
The MACD(14,22,3) indicator, encompassing both the histogram and signal line, acts as an auxiliary tool and can also be used as a signal source.
Significant speeches and reports (always noted in the news calendar) can profoundly influence the price dynamics. Hence, trading during their release calls for heightened caution. It may be reasonable to exit the market to prevent abrupt price reversals against the prevailing trend.
Beginning traders should always remember that not every trade will yield profit. Establishing a clear strategy coupled with sound money management is the cornerstone of sustained trading success.
Le recensioni analitiche di InstaForex ti renderanno pienamente consapevole delle tendenze del mercato! Essendo un cliente InstaForex, ti viene fornito un gran numero di servizi gratuiti per il trading efficiente.


