 Rimani
Condizioni di trading
Strumenti


On Friday, GBP/USD showed the same dull movement as the EUR/USD pair, with the only difference being that the British pound had at least two important reports at its disposal. Early in the morning, UK reports on GDP and industrial production reports were published. GDP grew by 0%, against forecasts of -0.1%, and industrial production grew by 0%, with a forecast of +0.1%. Thus, the deviations from market expectations were minimal, and it is not surprising that there was no market reaction. Traders also ignored the consumer sentiment index from the University of Michigan.
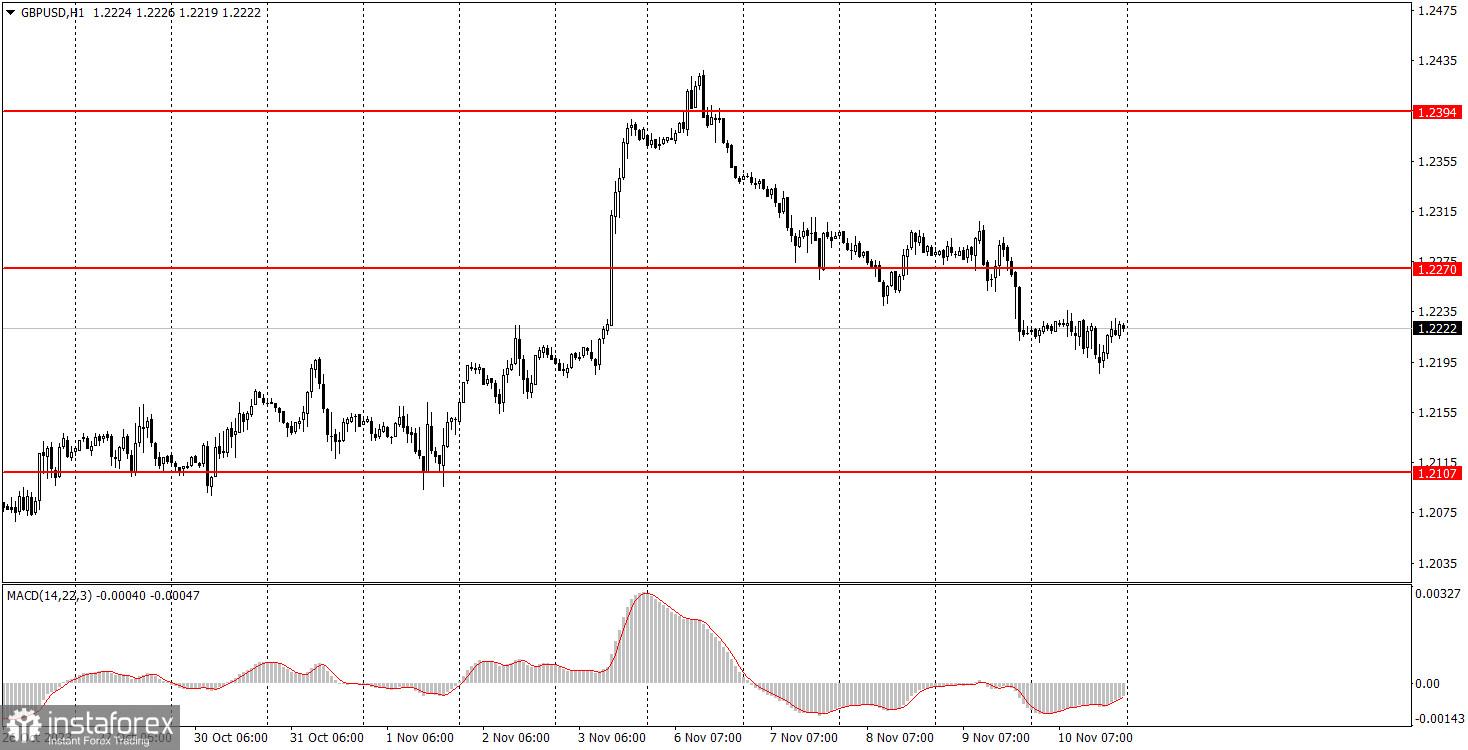
The British pound's situation is almost identical to the euro. We witnessed a downward movement that could be the start of a new prolonged trend. However, in the pound's case, it looks much more convincing than for the euro. Last week's fundamental and macroeconomic background has been weak, with almost all reports being either secondary or having neutral values.
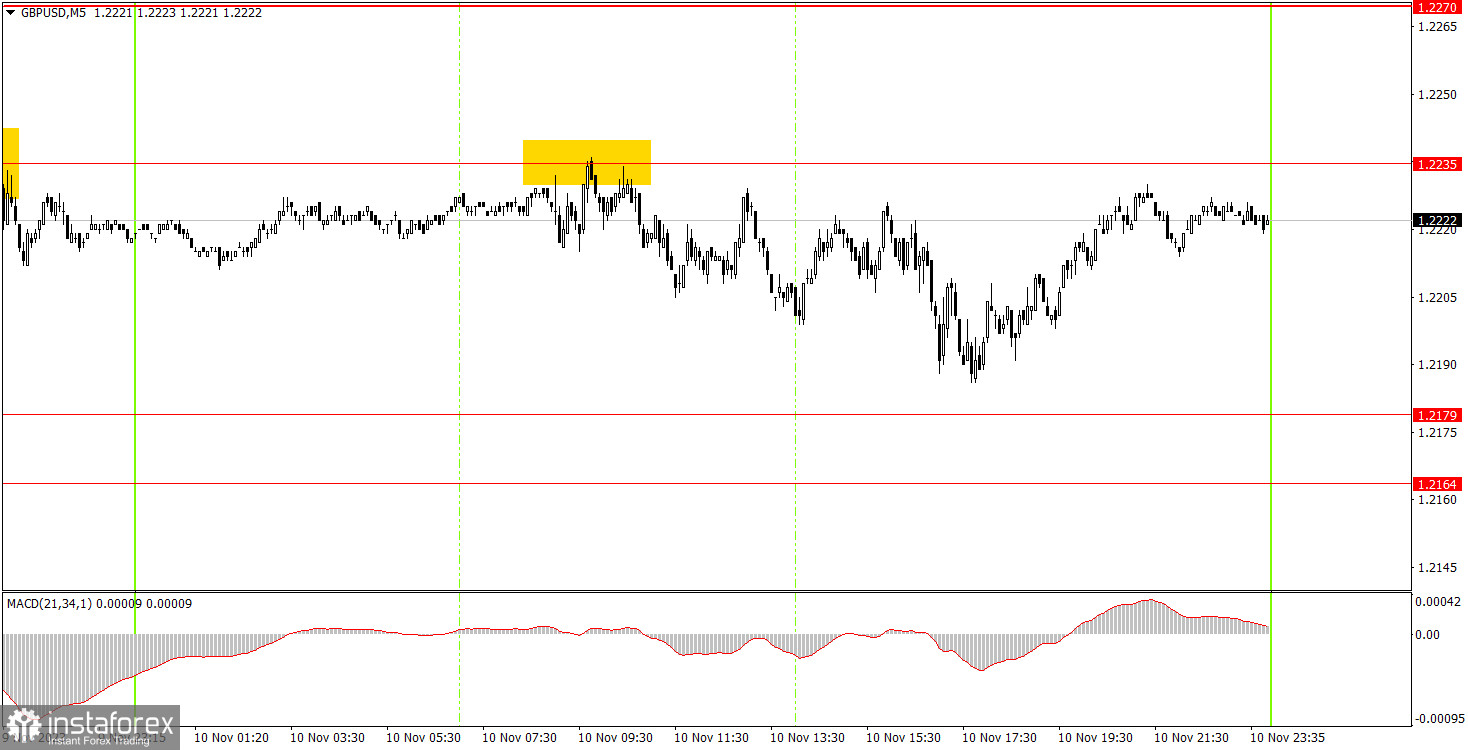
On the 5-minute chart, only one trading signal was generated. During the European trading session, the price bounced off the level of 1.2235, afterwards, within 6-7 hours, it managed to fall by 35 pips but still did not reach the level of 1.2179, as it fell short by only 7 pips. Therefore, beginners could close the deal anywhere. In any case, they still made profits, though relatively low, as the overall volatility of the day was 50 pips, which is quite low for the pound.
On the 30-minute chart, we had been anticipating a proper upward correction cycle for the GBP/USD pair for quite some time, and it has finally materialized. However, a week has passed since then, and at the moment, it seems that the corrective cycle has finally come to an end. In that case, the downtrend may resume. The pair has breached the level of 1.2270, so the pound can fall further. The key levels on the 5M chart are 1.1992-1.2010, 1.2052, 1.2089-1.2107, 1.2164-1.2179, 1.2235, 1.2270, 1.2310, 1.2372-1.2394, 1.2457-1.2488, 1.2544, 1.2605-1.2620, 1.2653, 1.2688. Once the price moves 20 pips in the right direction after opening a trade, you can set the stop-loss at breakeven. On Monday, there are no interesting reports scheduled in the UK or the US, so volatility is likely to remain low, and there may be a lack of trend movement.
1) Signal strength is determined by the time taken for its formation (either a bounce or level breach). A shorter formation time indicates a stronger signal.
2) If two or more trades around a certain level are initiated based on false signals, subsequent signals from that level should be disregarded.
3) In a flat market, any currency pair can produce multiple false signals or none at all. In any case, the flat trend is not the best condition for trading.
4) Trading activities are confined between the onset of the European session and mid-way through the U.S. session, after which all open trades should be manually closed.
5) On the 30-minute timeframe, trades based on MACD signals are only advisable amidst substantial volatility and an established trend, confirmed either by a trendline or trend channel.
6) If two levels lie closely together (ranging from 5 to 15 pips apart), they should be considered as a support or resistance zone.
Support and Resistance price levels can serve as targets when buying or selling. You can place Take Profit levels near them.
Red lines represent channels or trend lines, depicting the current market trend and indicating the preferable trading direction.
The MACD(14,22,3) indicator, encompassing both the histogram and signal line, acts as an auxiliary tool and can also be used as a signal source.
Significant speeches and reports (always noted in the news calendar) can profoundly influence the price dynamics. Hence, trading during their release calls for heightened caution. It may be reasonable to exit the market to prevent abrupt price reversals against the prevailing trend.
Beginners should always remember that not every trade will yield profit. Establishing a clear strategy coupled with sound money management is the cornerstone of sustained trading success.
Le recensioni analitiche di InstaForex ti renderanno pienamente consapevole delle tendenze del mercato! Essendo un cliente InstaForex, ti viene fornito un gran numero di servizi gratuiti per il trading efficiente.


