 Rimani
Condizioni di trading
Strumenti


The GBP/USD pair traded in quite a dull manner on Wednesday. There was nothing interesting about it. In fairness, there was only one report that could have piqued the interest of market participants. In the second half of the day, the second estimate of the U.S. Q3 GDP report was published, exceeding both the first estimate and the forecast. Thus, the U.S. currency should have received market support, but it did not. However, today, demand for the euro and pound decreased significantly due to the eurozone inflation data, which showed a value of 2.4% in November, slowing down by 0.5%. This report had a rather indirect significance for the pound, but the euro and pound are often traded together.
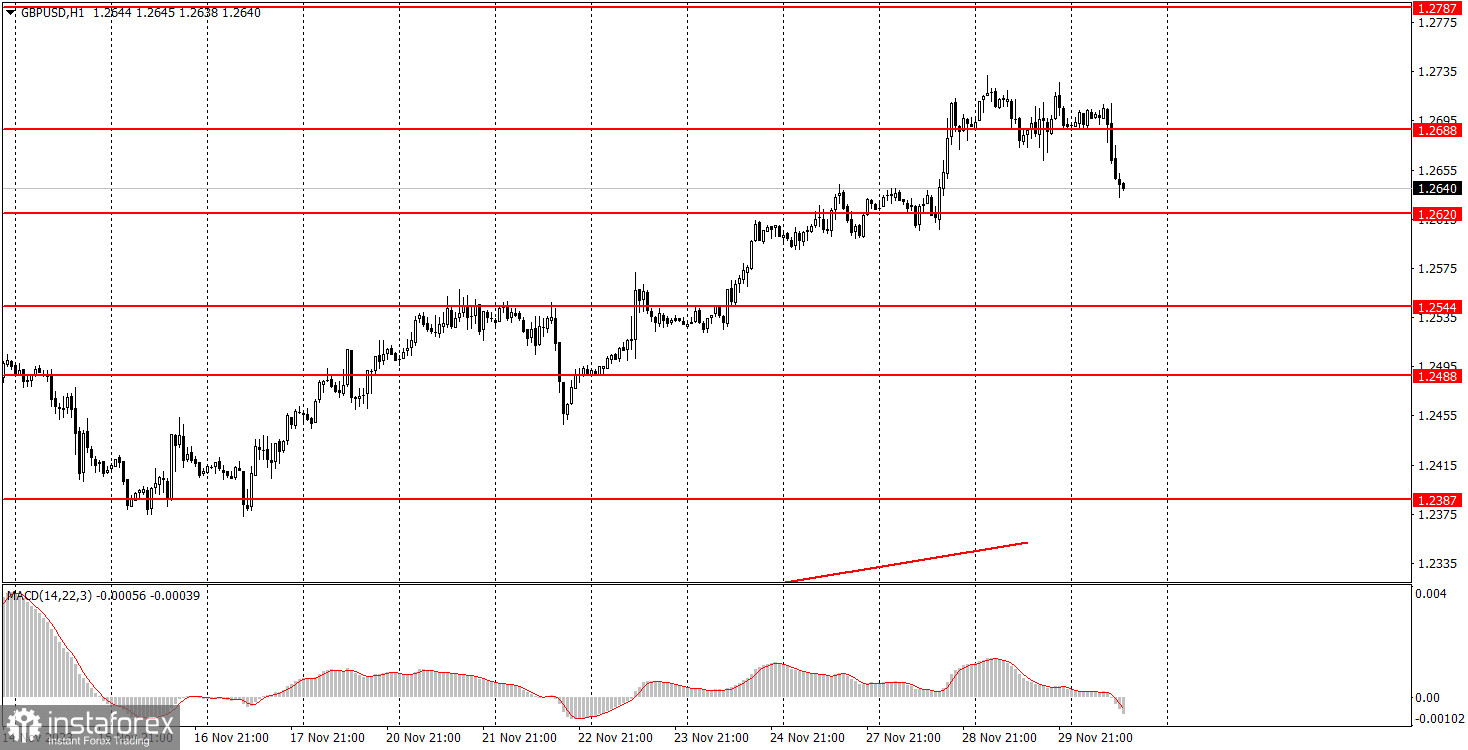
Nothing interesting scheduled for the UK this week. The pound edged down, so now it needs to build on the downward movement. The initial target is 1.2387.
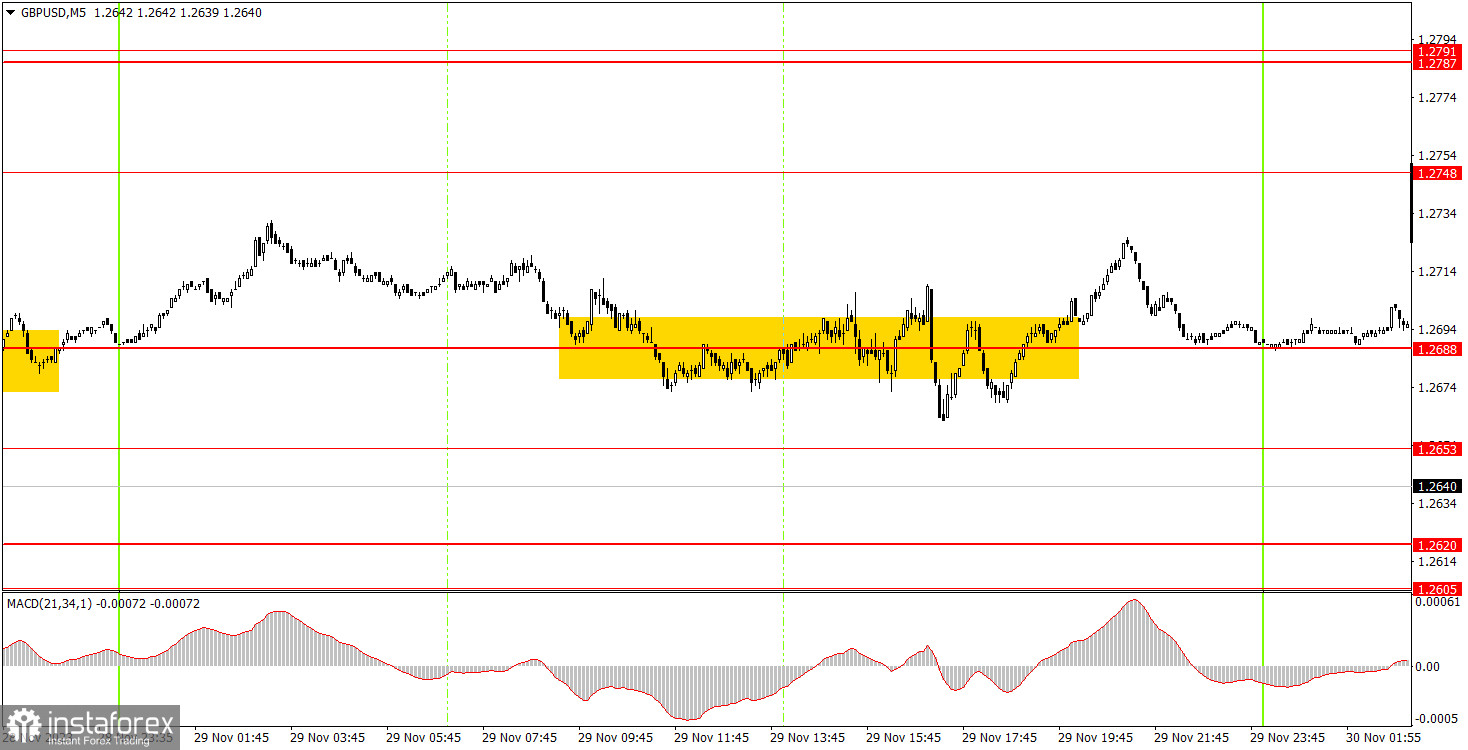
No meaningful signals on the 5-minute chart. The problem here lies not in the levels but in the nature of the movement. As seen in the chart above, the pair traded sideways for most of the day, so it was not possible to count on good trading signals. Unfortunately, there are such days, and there's nothing we can do about it.
On the 30-minute chart, the GBP/USD pair continues an uptrend. The anticipation is for this to conclude. Currently, we have an ascending trend line, and overcoming it will allow us to determine the end of the uptrend, but it is located quite far from the price. Therefore, we can't benefit from it. We expect a strong decline in the British currency, and perhaps it has already started today. The key levels on the 5M chart are 1.2270, 1.2310, 1.2372-1.2387, 1.2457-1.2488, 1.2544, 1.2605-1.2620, 1.2653, 1.2688, 1.2748, 1.2787-1.2791, 1.2848-1.2860. Once the price moves 20 pips in the right direction after opening a trade, you can set the stop-loss at breakeven. No interesting reports scheduled in the UK. The U.S. will release reports on unemployment claims, personal income and spending, and the Personal Consumption Expenditures Price Index. We consider these reports to be secondary of importance and unable to have a strong impact on market sentiment.
1) Signal strength is determined by the time taken for its formation (either a bounce or level breach). A shorter formation time indicates a stronger signal.
2) If two or more trades around a certain level are initiated based on false signals, subsequent signals from that level should be disregarded.
3) In a flat market, any currency pair can produce multiple false signals or none at all. In any case, the flat trend is not the best condition for trading.
4) Trading activities are confined between the onset of the European session and mid-way through the U.S. session, after which all open trades should be manually closed.
5) On the 30-minute timeframe, trades based on MACD signals are only advisable amidst substantial volatility and an established trend, confirmed either by a trendline or trend channel.
6) If two levels lie closely together (ranging from 5 to 15 pips apart), they should be considered as a support or resistance zone.
Support and Resistance price levels can serve as targets when buying or selling. You can place Take Profit levels near them.
Red lines represent channels or trend lines, depicting the current market trend and indicating the preferable trading direction.
The MACD(14,22,3) indicator, encompassing both the histogram and signal line, acts as an auxiliary tool and can also be used as a signal source.
Significant speeches and reports (always noted in the news calendar) can profoundly influence the price dynamics. Hence, trading during their release calls for heightened caution. It may be reasonable to exit the market to prevent abrupt price reversals against the prevailing trend.
Beginners should always remember that not every trade will yield profit. Establishing a clear strategy coupled with sound money management is the cornerstone of sustained trading success.
Le recensioni analitiche di InstaForex ti renderanno pienamente consapevole delle tendenze del mercato! Essendo un cliente InstaForex, ti viene fornito un gran numero di servizi gratuiti per il trading efficiente.


