 Rimani
Condizioni di trading
Strumenti


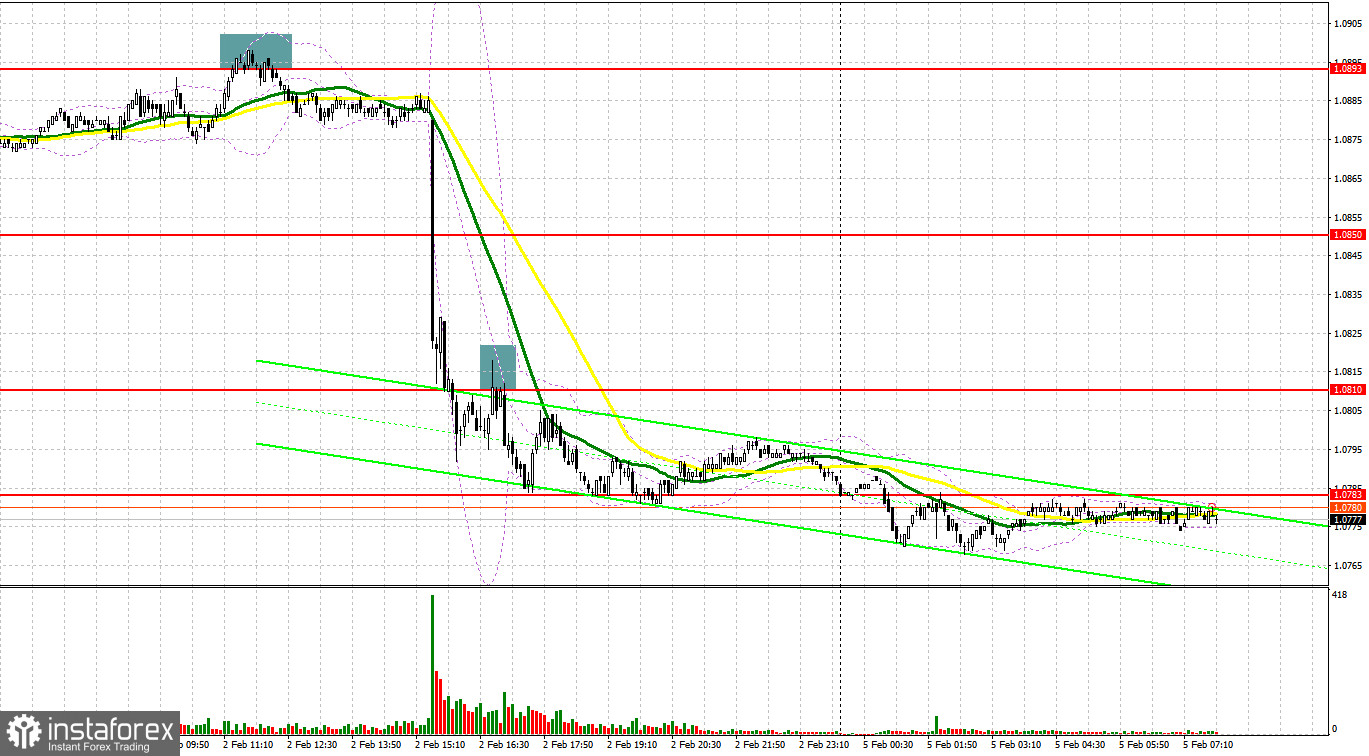
Last Friday, EUR/USD generated several signals to enter the market. Let's take a look at the 5-minute chart and discuss what happened. In my previous forecast, I focused on the level of 1.0893 and recommended making market entry decisions based on it. A rise and a false breakout near 1.0893 generated a sell signal, but after falling by 13 pips, the pressure on the pair decreased. In the afternoon, the euro dropped by more than 80 pips, while a breakout and retest of 1.0810 produced another sell signal as the bear market continued to advance, pulling about 30 pips off the market.
For long positions on EUR/USD
Last Friday, the market ignored the French industrial output data, but the fact that the US labor market continues to be in excellent shape prompted traders to get rid of the euro and buy the US dollar. This brought back the bearish market in the EUR/USD pair. Today, service sector PMIs from the euro area, the composite PMI index, and the eurozone Producer Price Index may provide fresh impetus. If the data is not revised in a positive direction or disappoints, the pair may be under pressure again, so it is better not to rush with long positions today.
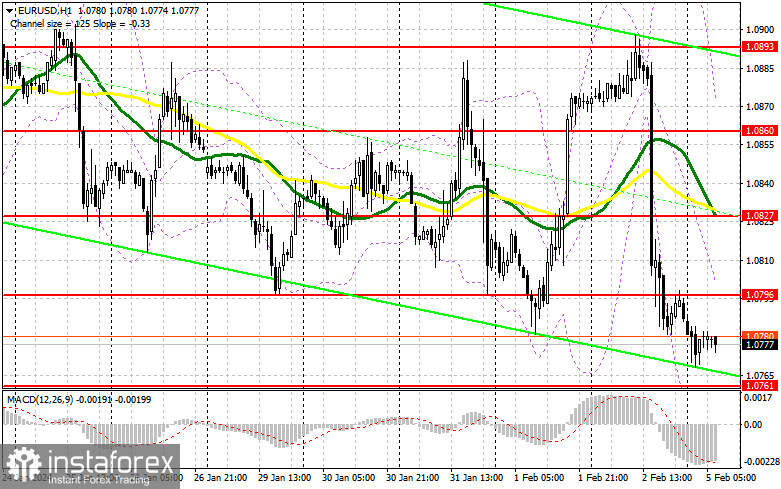
I will act on a decline after a false breakout in the area of 1.0761. This will create a good entry point into long positions against the trend, providing an opportunity for a correction and a rise towards the area of 1.0796. A breakout and a downward test of this range will create another entry point for long positions, providing an opportunity for a more powerful correction and the prospect of testing 1.0827, which is in line with the bearish moving averages. The ultimate target is found at the 1.0860 high, where I plan to take profits. Should EUR/USD decline and show no activity at 1.0761 in the first half of the day, the pressure on the pair will return. In this case, I will try to enter the market after a false breakout forms near 1.0727. I would consider opening long positions on a rebound from 1.0695, aiming for an upward correction of 30-35 pips within the day.
For short positions on EUR/USD:
Bears regained control on Friday, and today it is necessary to defend the new resistance at 1.0796. Protecting this level and forming a false breakout there after the release of weak eurozone data will indicate the presence of big players in the market, which could send the pair down to the area of 1.0761, which will support a new downtrend. A breakout and consolidation below this range, as well as an upward retest, will provide another selling entry point with the expectation of the pair's decline to the area of 1.0727. The ultimate target here is the 1.0695 low, where I plan to take profits. In case EUR/USD moves upwards during the European session without bearish activity at 1.0796, nothing terrible will happen for the sellers. It will be a chance to open short positions even higher. In such a case, it will be possible to enter the market after a test of the next resistance at 1.0827, which is in line with the moving averages. It is also possible to sell there but only after a failed consolidation. I plan to initiate short positions on a rebound from 1.0860, aiming for a downward correction of 30-35 pips.
COT report:
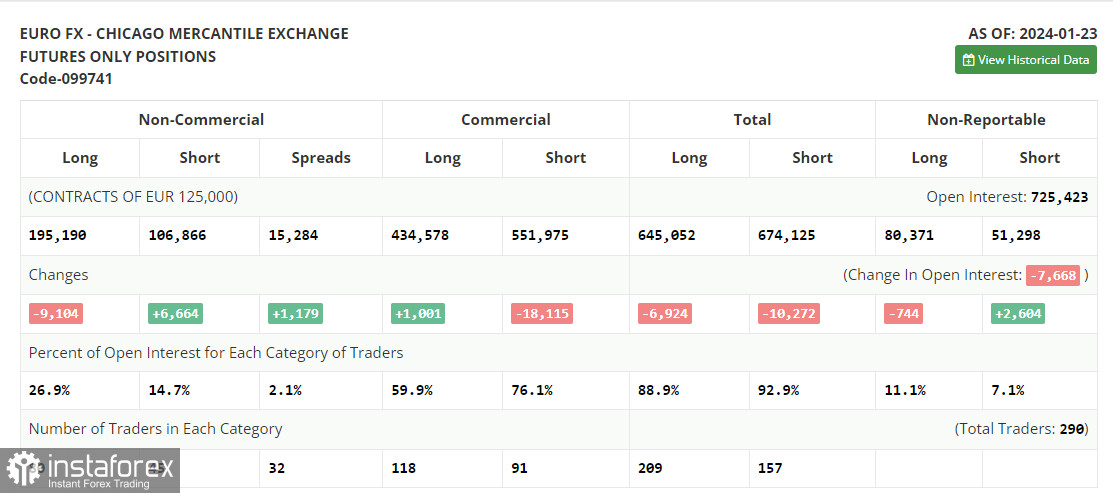
In the COT report (Commitment of Traders) for January 23, there was a decrease in long positions and an increase in short positions, indicating a shift in favor of the US dollar. After the European Central Bank meeting, where the central bank made it clear that they plan to lower interest rates as early as this summer, the euro came under pressure again. Buyers have nothing to worry about, as the strong US economy allows the Federal Reserve to stick to its tough policy without fearing a recession, unlike the eurozone economy. The Federal Open Market Committee meeting will make it clear what the central bank plans to do with its policy. The COT report indicated that long non-commercial positions fell by 9,104 to 195,190, while short non-commercial positions increased by 6,664 to 106,866. As a result, the spread between long and short positions increased by 1,179.
Indicator signals:
Moving averages:
Trading below the 30- and 50-day moving averages indicates possible decline.
Please note that the time period and levels of the moving averages are analyzed only for the 1H chart, which differs from the general definition of the classic daily moving averages on the 1D chart.
Bollinger Bands
If EUR/USD declines, the indicator's lower border near 1.0730 will serve as support.
Description of indicators:
• A moving average of a 50-day period determines the current trend by smoothing volatility and noise; marked in yellow on the chart;
• A moving average of a 30-day period determines the current trend by smoothing volatility and noise; marked in green on the chart;
• MACD Indicator (Moving Average Convergence/Divergence) Fast EMA with a 12-day period; Slow EMA with a 26-day period. SMA with a 9-day period;
• Bollinger Bands: 20-day period;
• Non-commercial traders are speculators such as individual traders, hedge funds, and large institutions who use the futures market for speculative purposes and meet certain requirements;
• Long non-commercial positions represent the total number of long positions opened by non-commercial traders;
• Short non-commercial positions represent the total number of short positions opened by non-commercial traders;
• The non-commercial net position is the difference between short and long positions of non-commercial traders.v
Le recensioni analitiche di InstaForex ti renderanno pienamente consapevole delle tendenze del mercato! Essendo un cliente InstaForex, ti viene fornito un gran numero di servizi gratuiti per il trading efficiente.


