 Rimani
Condizioni di trading
Strumenti


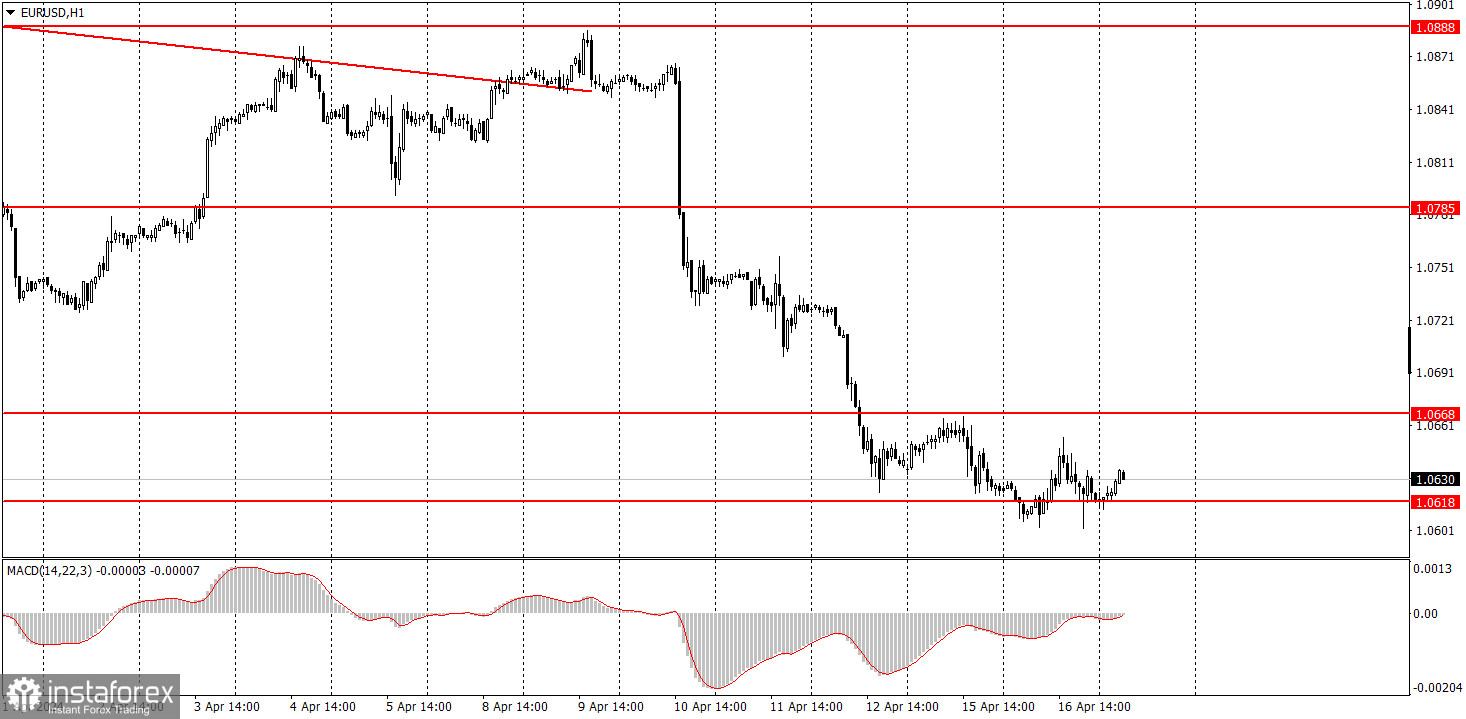
EUR/USD failed to either extend its downward movement or initiate a bullish correction on Tuesday. Volatility remained low for the second consecutive day, despite macroeconomic events and fundamentals. In particular, economic expectation indexes from the ZEW Institute were published in the EU. As we mentioned earlier, these reports were considered secondary of importance and were not expected to have any impact on the pair's movement. This turned out to be the case. In addition, Federal Reserve representative Mary Daly spoke, who said that there is "no urgency" to cut US interest rates, and interest rates will start to decline when inflation approaches the target level.
In addition to this, the US published several reports. Data on the construction sector turned out to be worse than forecast, while industrial production was in line with expectations. Therefore, the dollar did not receive support, but neither did it decline. The downtrend persists.
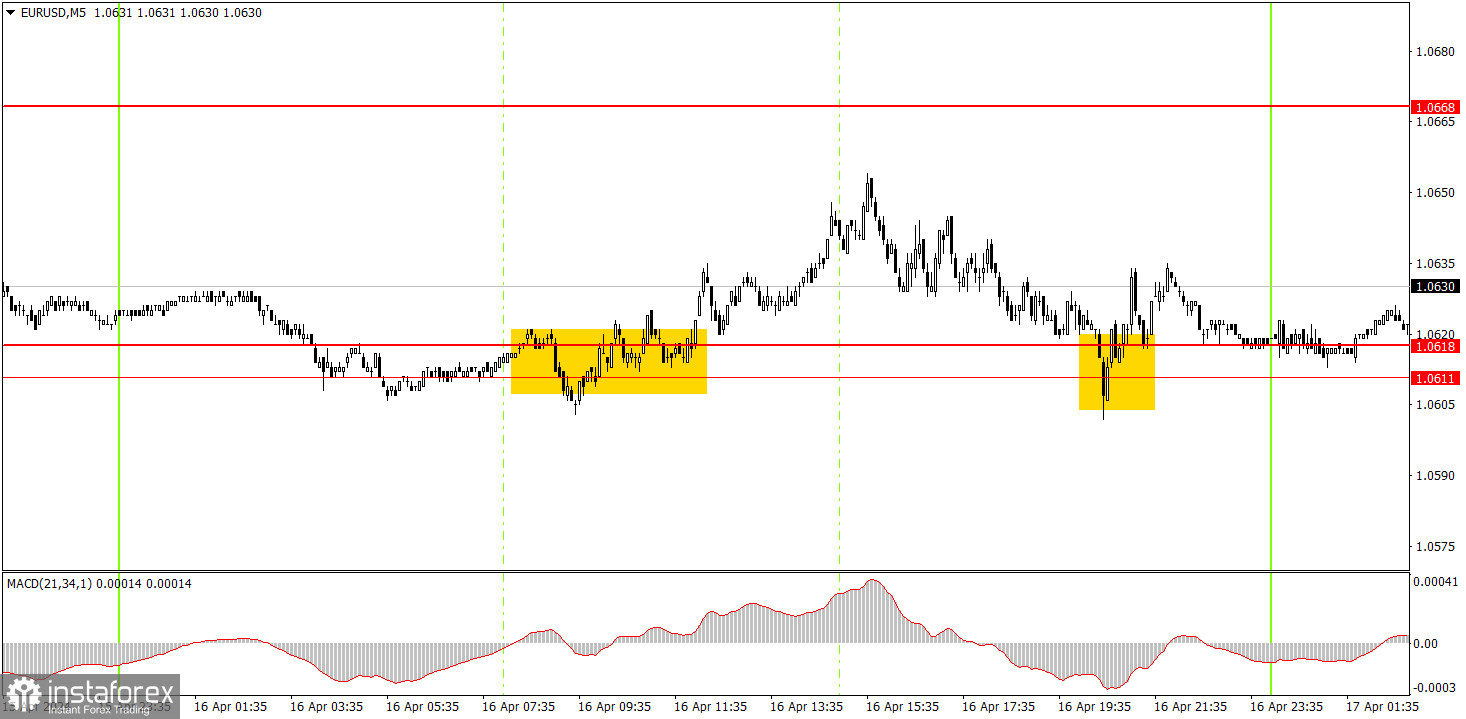
Two trading signals were generated on the 5-minute timeframe, albeit not precise ones. The pair bounced twice from the area of 1.0611-1.0618, but it didn't make sense to execute the second signal as it was formed quite late. Nevertheless, it was still a signal, and traders could enter the market with long positions. Beginners could not earn profit from the first long position because the price did not reach the target level of 1.0668.
On the hourly chart, the downtrend persists. We believe that the euro should continue to fall, as it is still too high, and in general, the trend is headed downwards. The recent macro data have provided full support for the US dollar. The fundamental background indicates that the European Central Bank will start lowering rates at the next meeting, while the Fed will do so much later.
The pair may attempt another correction since the price has not breached the level of 1.0618. If the price consolidates below it today, then we can expect the euro to fall towards 1.0568.
The key levels on the 5M chart are 1.0483, 1.0526, 1.0568, 1.0611-1.0618, 1.0668, 1.0725, 1.0785-1.0797, 1.0838-1.0856, 1.0888-1.0896, 1.0940, 1.0971-1.0981. The final value of the euro area Consumer Price Index for March is due on Wednesday (which is always less interesting than the first), while there is nothing interesting in the US. Thus, most likely, we are in for a third consecutive dull day.
1) Signal strength is determined by the time taken for its formation (either a bounce or level breach). A shorter formation time indicates a stronger signal.
2) If two or more trades around a certain level are initiated based on false signals, subsequent signals from that level should be disregarded.
3) In a flat market, any currency pair can produce multiple false signals or none at all. In any case, the flat trend is not the best condition for trading.
4) Trading activities are confined between the onset of the European session and mid-way through the U.S. session, after which all open trades should be manually closed.
5) On the 30-minute timeframe, trades based on MACD signals are only advisable amidst substantial volatility and an established trend, confirmed either by a trendline or trend channel.
6) If two levels lie closely together (ranging from 5 to 15 pips apart), they should be considered as a support or resistance zone.
Support and Resistance price levels can serve as targets when buying or selling. You can place Take Profit levels near them.
Red lines represent channels or trend lines, depicting the current market trend and indicating the preferable trading direction.
The MACD(14,22,3) indicator, encompassing both the histogram and signal line, acts as an auxiliary tool and can also be used as a signal source.
Significant speeches and reports (always noted in the news calendar) can profoundly influence the price dynamics. Hence, trading during their release calls for heightened caution. It may be reasonable to exit the market to prevent abrupt price reversals against the prevailing trend.
Beginning traders should always remember that not every trade will yield profit. Establishing a clear strategy coupled with sound money management is the cornerstone of sustained trading success.
Le recensioni analitiche di InstaForex ti renderanno pienamente consapevole delle tendenze del mercato! Essendo un cliente InstaForex, ti viene fornito un gran numero di servizi gratuiti per il trading efficiente.

