 Rimani
Condizioni di trading
Strumenti


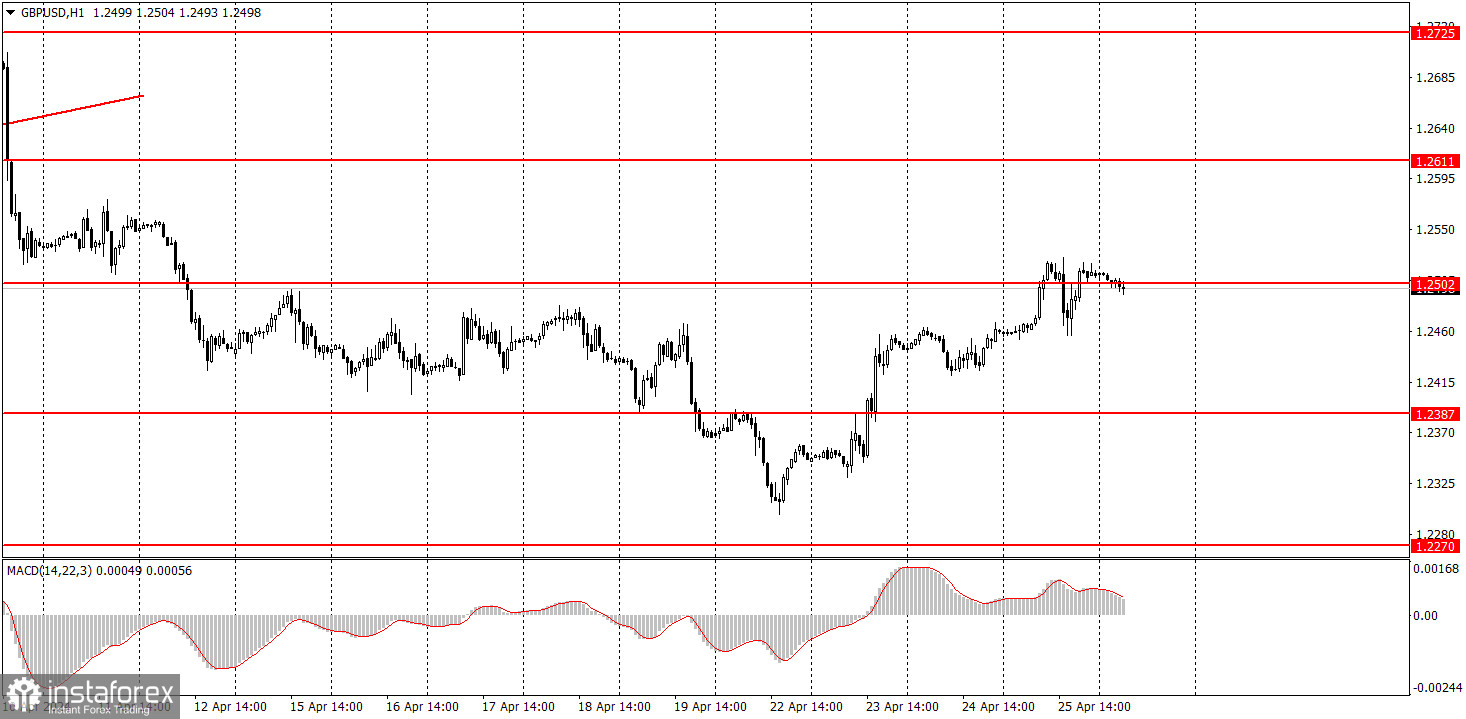
The GBP/USD pair continued to correct higher on Thursday. The US GDP report had an influence on the pair's movement, as there were simply no other events or reports during the day. The British pound only managed to rise to the level of 1.2502 because the quarterly GDP figure turned out to be one and a half times lower than forecasted. The American economy is slowing down, and this is bad news. The fact that US economic growth cooled will lead to a slowdown in inflation in the future. And the faster inflation slows down, the sooner the Federal Reserve will move to ease its monetary policy, which is bad for the dollar. We still believe that the market has not priced in half of the factors causing the GBP/USD pair's decline, so we expect it to fall further. For now, the downtrend remains intact.
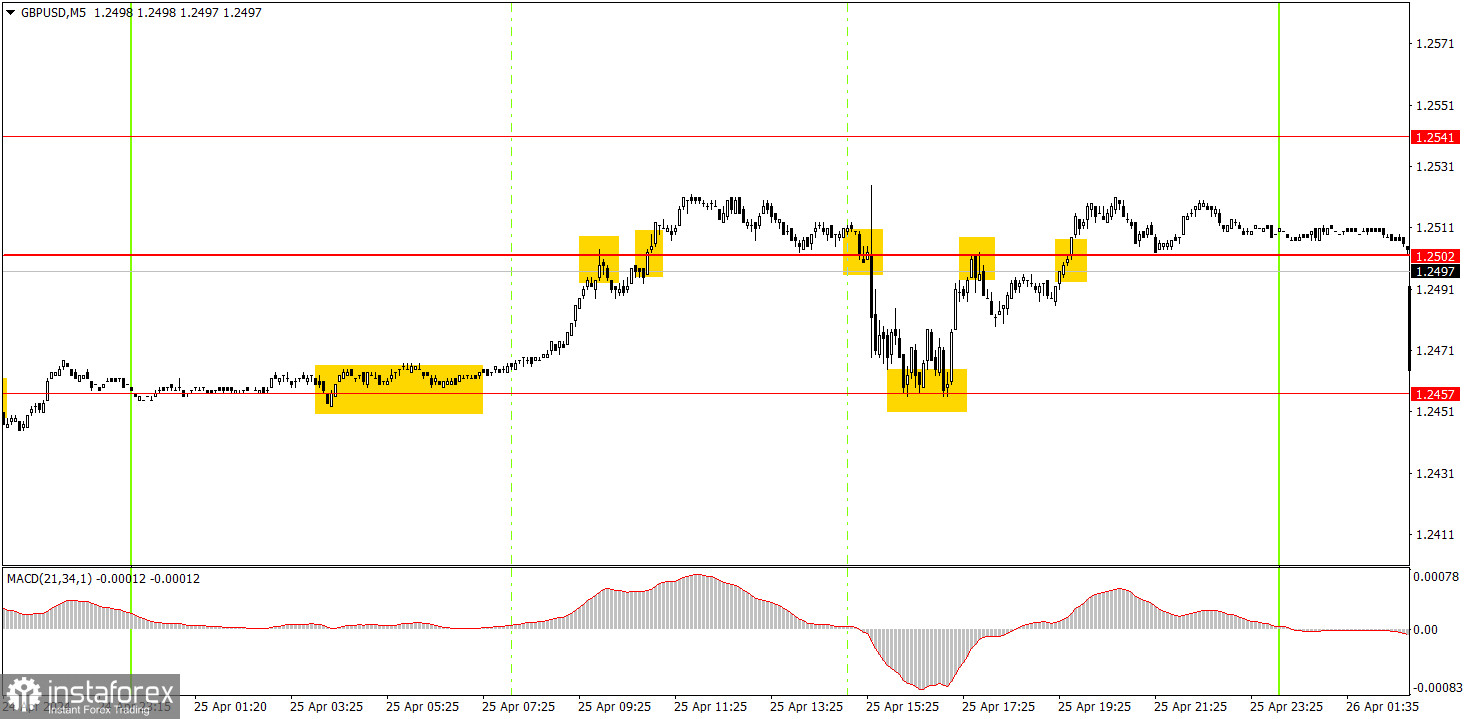
Several trading signals were generated on the 5-minute timeframe. In the morning, long positions could be opened near the level of 1.2457. Unfortunately, a false sell signal was formed around the level of 1.2502, followed by a false buy signal, which offset the profit from the first trade. Therefore, it was necessary to execute signals that were not formed around the level of 1.2502. There was one particular signal – a rebound at the beginning of the US session from the level of 1.2457. Like the first signal, this turned out to be the right signal and beginners could earn another 25 pips. Overall, the day was chaotic but still profitable.
On the hourly chart, the GBP/USD pair has excellent prospects for forming a downward trend, but is currently going through a correction. After surpassing the level of 1.2502, traders may expect a significant decline from the pound. The fundamental and macroeconomic backdrop continues to support the dollar much more than the British pound. Therefore, we only expect downward movement from the pair.
Today, novice traders can look for new sell signals around the level of 1.2502. The market is not in a rush to sell, but the pound is gradually depreciating in the medium term, which is a good sign. The pair may continue to correct higher if today's US data turns out to be weaker than expected.
The key levels on the 5M chart are 1.2270, 1.2310, 1.2372-1.2387, 1.2457, 1.2502, 1.2544, 1.2605-1.2611, 1.2648, 1.2691, 1.2725, 1.2787-1.2791. There are no significant events planned in the UK for today, while the US will release Personal Income and Spending, the University of Michigan Consumer Sentiment Index, and the Personal Consumption Expenditures Price Index (PCE).
1) Signal strength is determined by the time taken for its formation (either a bounce or level breach). A shorter formation time indicates a stronger signal.
2) If two or more trades around a certain level are initiated based on false signals, subsequent signals from that level should be disregarded.
3) In a flat market, any currency pair can produce multiple false signals or none at all. In any case, the flat trend is not the best condition for trading.
4) Trading activities are confined between the onset of the European session and mid-way through the U.S. session, after which all open trades should be manually closed.
5) On the 30-minute timeframe, trades based on MACD signals are only advisable amidst substantial volatility and an established trend, confirmed either by a trendline or trend channel.
6) If two levels lie closely together (ranging from 5 to 15 pips apart), they should be considered as a support or resistance zone.
Support and Resistance price levels can serve as targets when buying or selling. You can place Take Profit levels near them.
Red lines represent channels or trend lines, depicting the current market trend and indicating the preferable trading direction.
The MACD(14,22,3) indicator, encompassing both the histogram and signal line, acts as an auxiliary tool and can also be used as a signal source.
Significant speeches and reports (always noted in the news calendar) can profoundly influence the price dynamics. Hence, trading during their release calls for heightened caution. It may be reasonable to exit the market to prevent abrupt price reversals against the prevailing trend.
Beginners should always remember that not every trade will yield profit. Establishing a clear strategy coupled with sound money management is the cornerstone of sustained trading success.
Le recensioni analitiche di InstaForex ti renderanno pienamente consapevole delle tendenze del mercato! Essendo un cliente InstaForex, ti viene fornito un gran numero di servizi gratuiti per il trading efficiente.


