 Rimani
Condizioni di trading
Strumenti


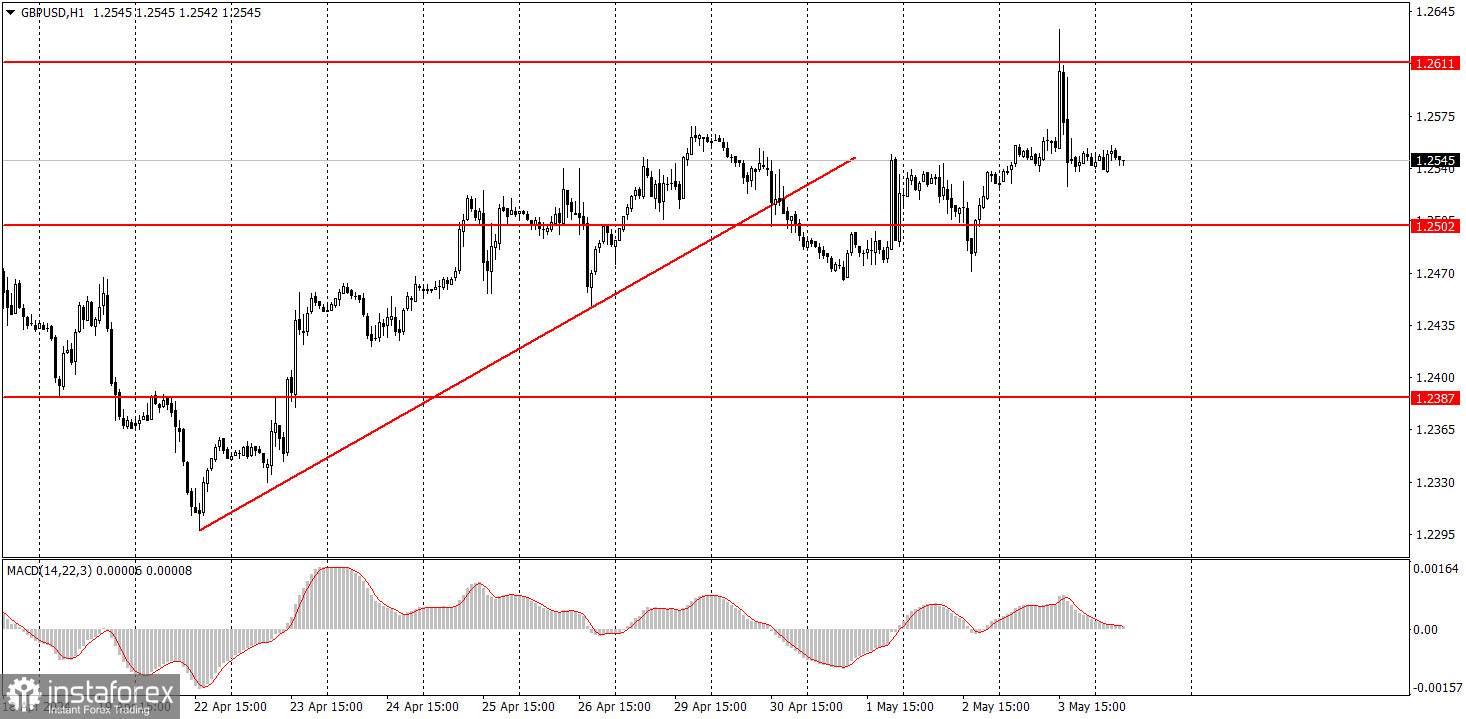
The GBP/USD pair continued its upward movement on Friday. As seen in the chart above, the price consolidated below the ascending trend line last week. At this point, the upward correction was supposed to end. However, a series of weak reports on the US labor market, unemployment, business activity, and job vacancies triggered a new and predictable decline in the US currency. We still believe that the fundamental background largely supports the dollar, while the pound's current rise is part of a corrective move. Therefore, we expect the global downward trend to resume. Over the past two weeks, economic data have disappointed the dollar, but this may not always be the case. The state of the British economy has been less than ideal for several years now. A bounce from the level of 1.2611 could mark the start of a new downward trend.
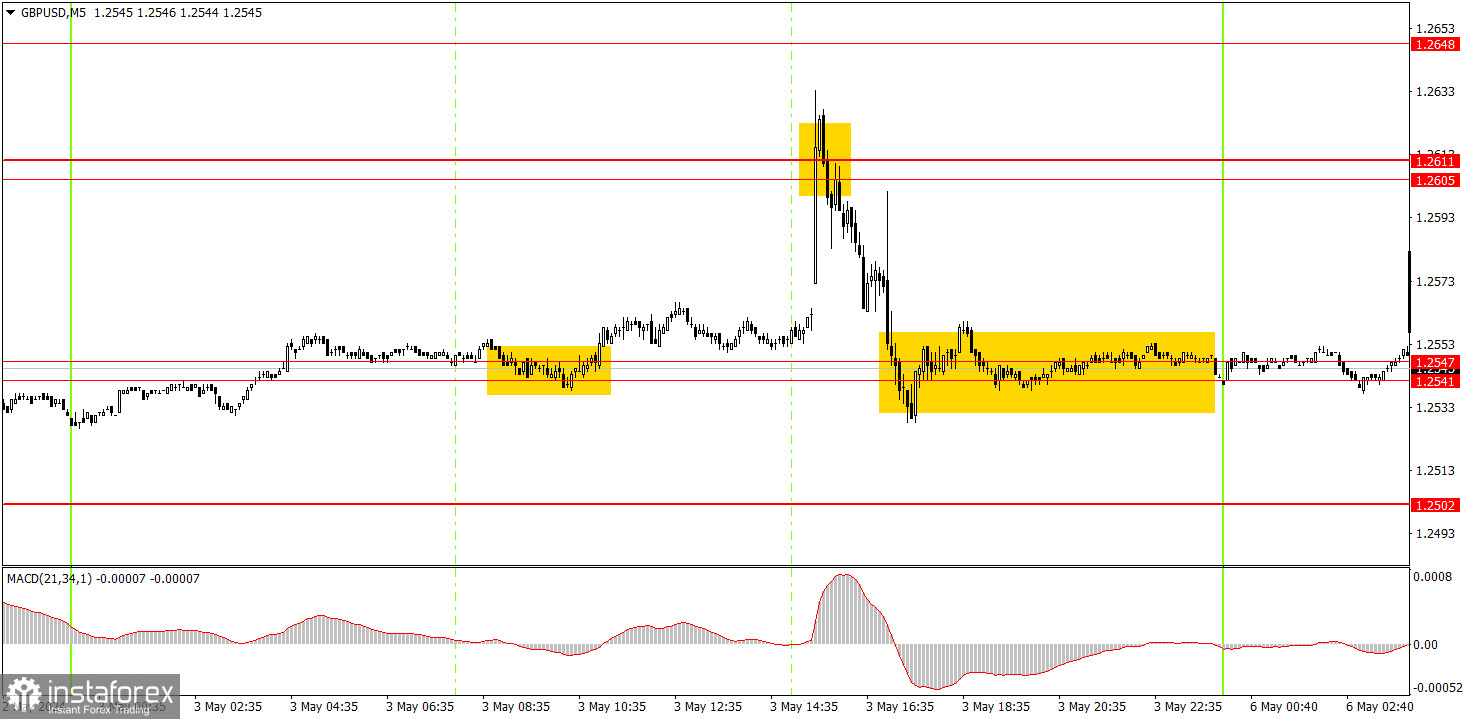
An excellent buy signal was formed during the European trading session, although the pair remained relatively unchanged throughout the session. However, significantly weaker-than-expected US macro data prompted a rise, which traders needed. In the afternoon, the range of 1.2605-1.2611 was tested, from which there was an imprecise rebound. This rebound could also have been interpreted as a signal, but this time it was for selling. However, it was difficult to say whether traders should have acted on it or not. It was also difficult to expect the dollar to rise with such weak US data. Nevertheless, those who opened short positions made profit, as the price returned to the range of 1.2541-1.2547 by the end of the day.
On the hourly chart, the GBP/USD pair has excellent prospects for forming a downward trend, but is currently going through a correction. This corrective phase has been quite strong. The fundamental backdrop continues to support the dollar much more than the British pound. Therefore, we only expect downward movement from the pair.
On Monday, the market is in a flat state, and there's a high chance that it will be another "boring Monday". Investors may trade from the range of 1.2541-1.2547, but as mentioned, there's also a very high chance of a flat market.
The key levels on the 5M chart are 1.2270, 1.2310, 1.2372-1.2387, 1.2457, 1.2502, 1.2541-1.2547, 1.2605-1.2611, 1.2648, 1.2691, 1.2725, 1.2787-1.2791. Today, there are no scheduled events or reports in the UK and the US. Therefore, we don't expect strong movements today.
1) Signal strength is determined by the time taken for its formation (either a bounce or level breach). A shorter formation time indicates a stronger signal.
2) If two or more trades around a certain level are initiated based on false signals, subsequent signals from that level should be disregarded.
3) In a flat market, any currency pair can produce multiple false signals or none at all. In any case, the flat trend is not the best condition for trading.
4) Trading activities are confined between the onset of the European session and mid-way through the U.S. session, after which all open trades should be manually closed.
5) On the 30-minute timeframe, trades based on MACD signals are only advisable amidst substantial volatility and an established trend, confirmed either by a trendline or trend channel.
6) If two levels lie closely together (ranging from 5 to 15 pips apart), they should be considered as a support or resistance zone.
Support and Resistance price levels can serve as targets when buying or selling. You can place Take Profit levels near them.
Red lines represent channels or trend lines, depicting the current market trend and indicating the preferable trading direction.
The MACD(14,22,3) indicator, encompassing both the histogram and signal line, acts as an auxiliary tool and can also be used as a signal source.
Significant speeches and reports (always noted in the news calendar) can profoundly influence the price dynamics. Hence, trading during their release calls for heightened caution. It may be reasonable to exit the market to prevent abrupt price reversals against the prevailing trend.
Beginners should always remember that not every trade will yield profit. Establishing a clear strategy coupled with sound money management is the cornerstone of sustained trading success.
Le recensioni analitiche di InstaForex ti renderanno pienamente consapevole delle tendenze del mercato! Essendo un cliente InstaForex, ti viene fornito un gran numero di servizi gratuiti per il trading efficiente.


