 Rimani
Condizioni di trading
Strumenti


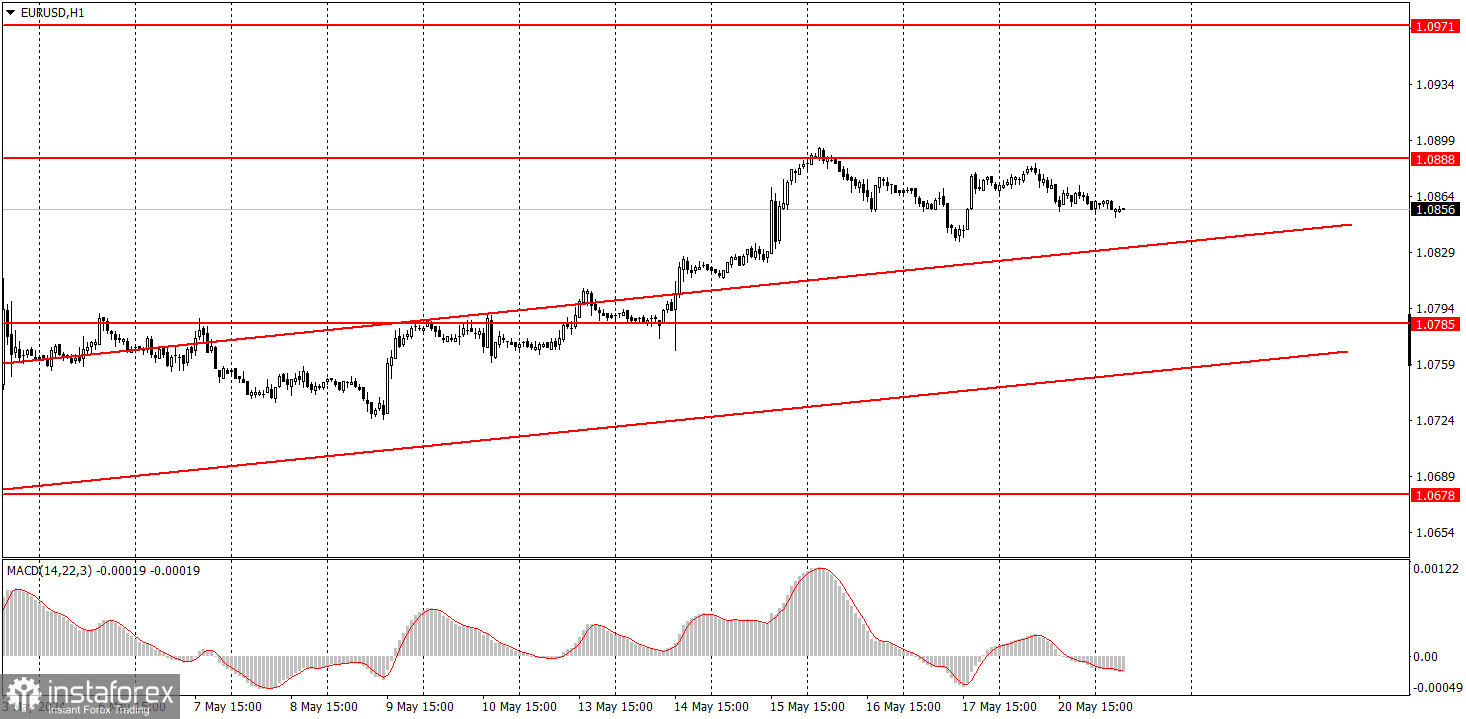
EUR/USD continued to hover near its local highs throughout Monday. Bears lack the strength to start a correction at the moment, so the pair simply moves sideways, slightly below the 1.0888 level. No important or even secondary events in both the EU and the US. The pair's volatility was just around 30 pips, which proves that there was nothing to analyze.
The euro frequently continues to rise without any reasons or grounds. Take note that the European Central Bank's first rate cut is scheduled for next month, so the euro should have turned downwards and started a decline. The ECB's rate is 1% lower than the Federal Reserve's rate, and the gap between them will widen further from June onwards. Therefore, we still believe that the pair should sharply move to the downside, and it should last for a long time. However, the upward movement persists, which is still considered a correction and has been ongoing for over a month. There are currently no technical signals to change the trend.
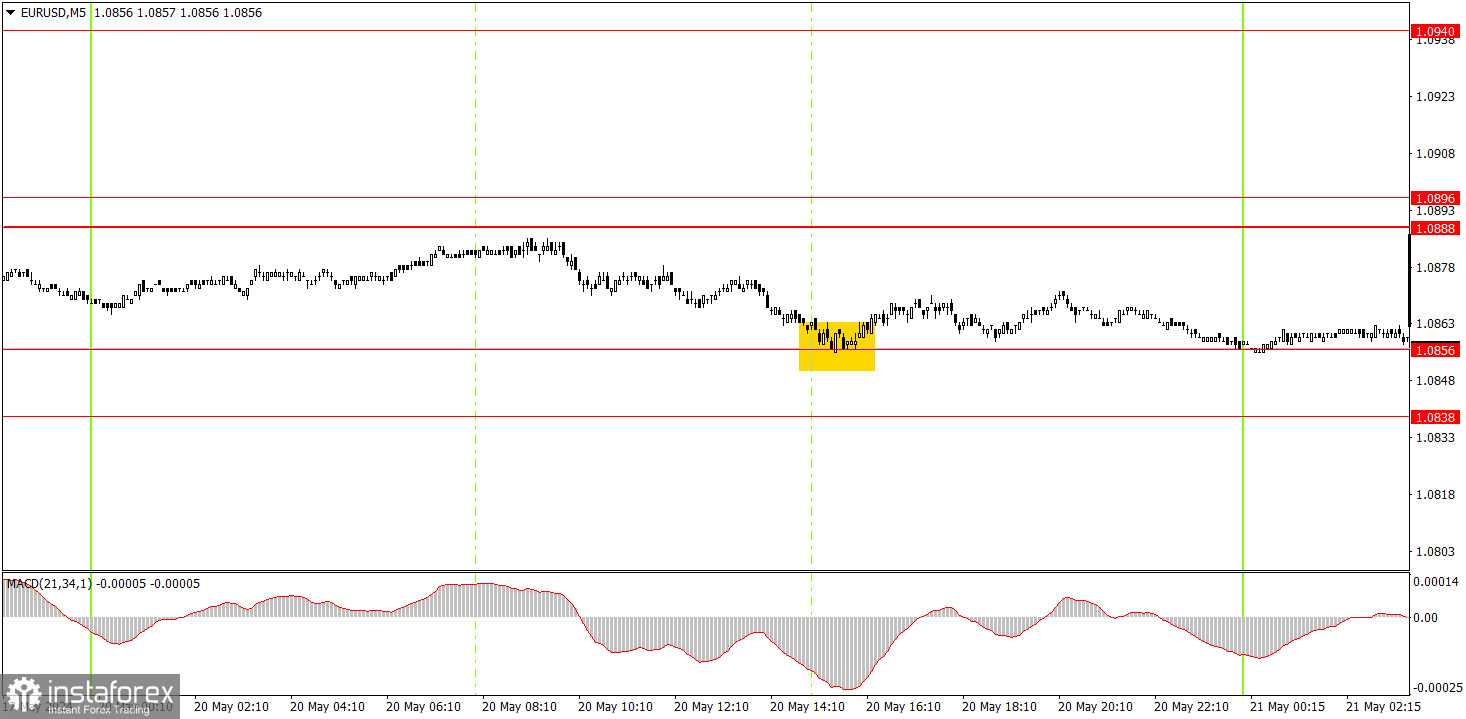
There's no point in assessing the trading signals on the 5-minute timeframe. It wasn't even worth looking for them since volatility was quite low, and the price practically moved sideways all day. However, during the beginning of the US trading session, the pair rebounded from the 1.0856 level, but the price didn't even rise by 10 pips. Once again, we will remind you that if there's no movement in the market, no trading signal will bring profit.
On the hourly chart, the EUR/USD pair continues to correct higher, which increasingly resembles an independent trend. We believe that the decline should resume in the medium term, as the euro remains expensive, and the overall trend is downward. However, for unknown reasons, the market refuses to buy the dollar. Perhaps a new strong downward trend is just around the corner.
On Tuesday, novice traders can look for signals around the areas of 1.0838-1.0856 and 1.0888-1.0896 and 1.0888-1.0896. These are fairly strong areas that can generate both buy and sell signals.
The key levels on the 5M chart are 1.0483, 1.0526, 1.0568, 1.0611, 1.0678, 1.0725-1.0733, 1.0785-1.0797, 1.0838-1.0856, 1.0888-1.0896, 1.0940, 1.0971-1.0981. Today, there are no significant events lined up in the US and the EU, so we'll likely face another boring day.
1) Signal strength is determined by the time taken for its formation (either a bounce or level breach). A shorter formation time indicates a stronger signal.
2) If two or more trades around a certain level are initiated based on false signals, subsequent signals from that level should be disregarded.
3) In a flat market, any currency pair can produce multiple false signals or none at all. In any case, the flat trend is not the best condition for trading.
4) Trading activities are confined between the onset of the European session and mid-way through the U.S. session, after which all open trades should be manually closed.
5) On the 30-minute timeframe, trades based on MACD signals are only advisable amidst substantial volatility and an established trend, confirmed either by a trendline or trend channel.
6) If two levels lie closely together (ranging from 5 to 15 pips apart), they should be considered as a support or resistance zone.
Support and Resistance price levels can serve as targets when buying or selling. You can place Take Profit levels near them.
Red lines represent channels or trend lines, depicting the current market trend and indicating the preferable trading direction.
The MACD(14,22,3) indicator, encompassing both the histogram and signal line, acts as an auxiliary tool and can also be used as a signal source.
Significant speeches and reports (always noted in the news calendar) can profoundly influence the price dynamics. Hence, trading during their release calls for heightened caution. It may be reasonable to exit the market to prevent abrupt price reversals against the prevailing trend.
Beginners should always remember that not every trade will yield profit. Establishing a clear strategy coupled with sound money management is the cornerstone of sustained trading success.
Le recensioni analitiche di InstaForex ti renderanno pienamente consapevole delle tendenze del mercato! Essendo un cliente InstaForex, ti viene fornito un gran numero di servizi gratuiti per il trading efficiente.

