 Rimani
Condizioni di trading
Strumenti


Yesterday, EUR/USD continued to edge down as part of the correction against the correction. Beginners should understand that all of the pair's upward movement in the last month is part of a correction, which is perfectly visible on the 24-hour timeframe. The correction continues to persist but the pair's movements are quite slow, so it looks like an independent trend on the lower timeframes. And last week's downward movement is a correction against this trend. In general, volatility remains weak and in most cases, it reaches about 40 pips a day. Therefore, it is very difficult and sometimes even futile to trade the pair on the lower charts. Especially intraday.
Germany, the European Union and the US released Services and Manufacturing PMI data on Thursday. Generally speaking, all three showed very good values, most of them were above forecasts. Thus, the euro rose in the morning due to good data, while the dollar rose in the afternoon.
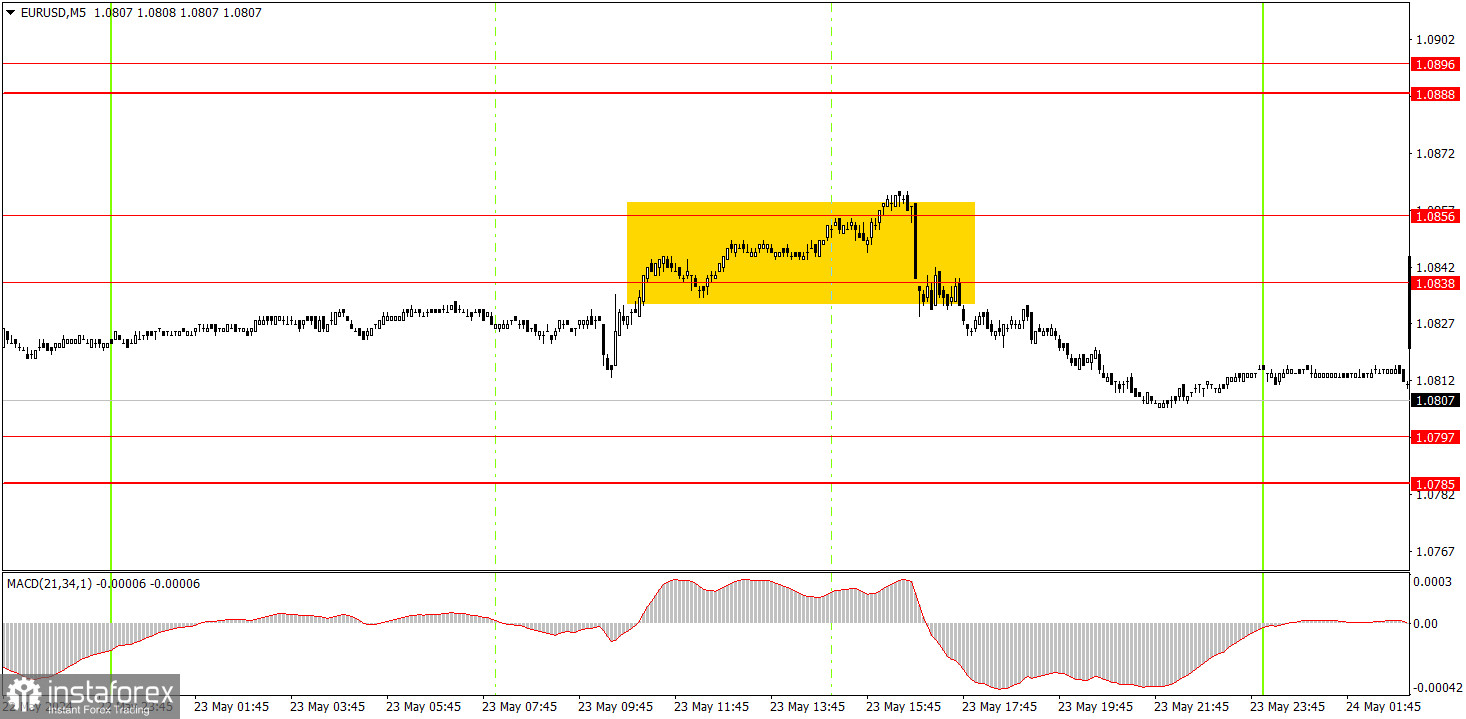
Only one sell signal was formed on the 5-minute timeframe, the accuracy of which left much to be desired, like all of the pair's movements lately. The price bounced from the area of 1.0838-1.0856, but this one took about seven hours. The signal was formed when traders could already leave the market. However, those who were in it to be bearish, could get about 10-15 pips of profit. In general, traders shouldn't count on big profits right now.
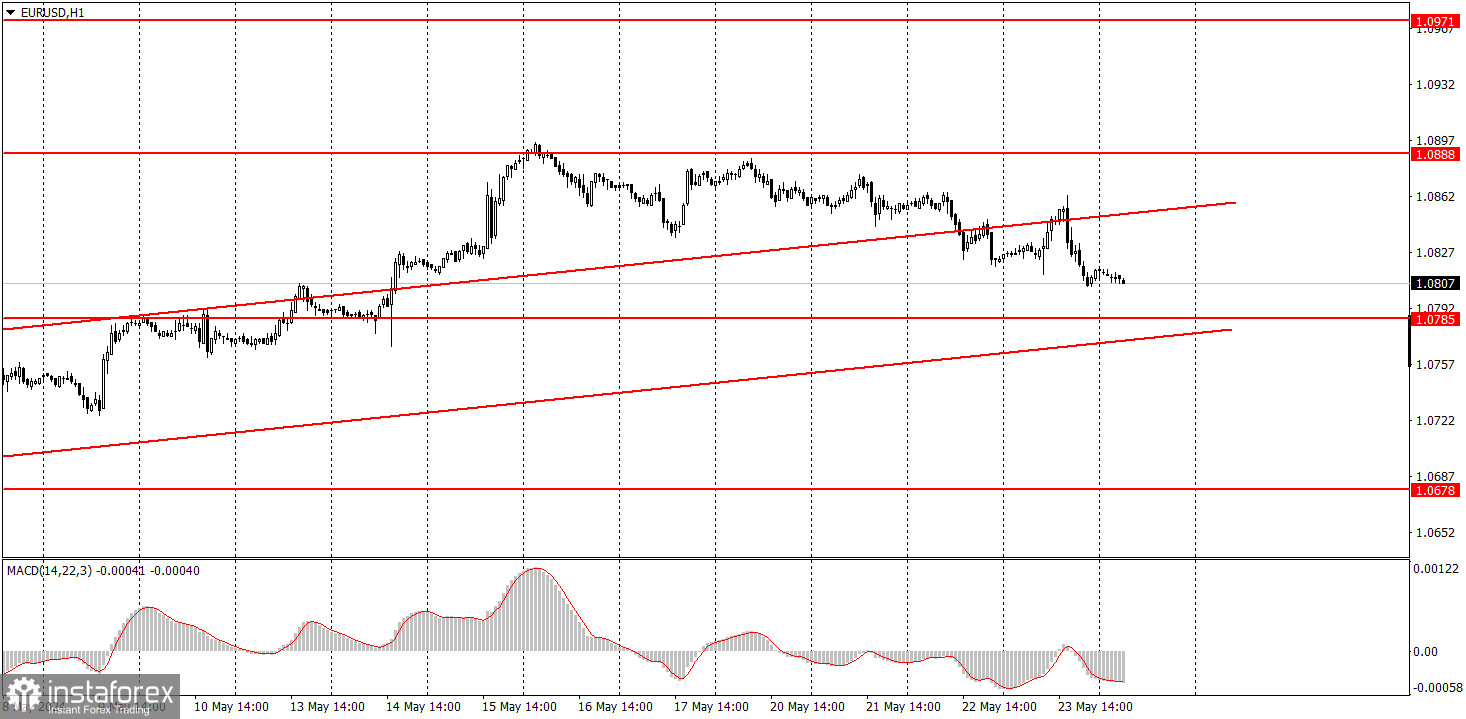
On the hourly chart, the bullish correction remains intact, which increasingly resembles an independent trend. We believe that the euro should fall in the medium term, and the global trend is downward. Nevertheless, the market still refuses to buy the dollar for unknown reasons and volatility also remains low.
On Friday, novice traders can continue to look for signals near the 1.0785-1.0797 and 1.0838-1.0856 areas. Since the pair did fall, you may prioritize sell signals. But we should take note of the weak volatility.
The key levels on the 5M chart are 1.0483, 1.0526,1.0568, 1.0611, 1.0678, 1.0725-1.0733, 1.0785-1.0797, 1.0838-1.0856, 1.0888-1.0896, 1.0940, 1.0971-1.0981. Today, the German GDP report will be released. The US docket will feature important data on durable goods orders and consumer sentiment from the University of Michigan. These reports may provoke a market reaction, but the overall volatility shows that the reaction is unlikely to be stronger than 20-25 pips.
1) Signal strength is determined by the time taken for its formation (either a bounce or level breach). A shorter formation time indicates a stronger signal.
2) If two or more trades around a certain level are initiated based on false signals, subsequent signals from that level should be disregarded.
3) In a flat market, any currency pair can produce multiple false signals or none at all. In any case, the flat trend is not the best condition for trading.
4) Trading activities are confined between the onset of the European session and mid-way through the U.S. session, after which all open trades should be manually closed.
5) On the 30-minute timeframe, trades based on MACD signals are only advisable amidst substantial volatility and an established trend, confirmed either by a trendline or trend channel.
6) If two levels lie closely together (ranging from 5 to 15 pips apart), they should be considered as a support or resistance zone.
Support and Resistance price levels can serve as targets when buying or selling. You can place Take Profit levels near them.
Red lines represent channels or trend lines, depicting the current market trend and indicating the preferable trading direction.
The MACD(14,22,3) indicator, encompassing both the histogram and signal line, acts as an auxiliary tool and can also be used as a signal source.
Significant speeches and reports (always noted in the news calendar) can profoundly influence the price dynamics. Hence, trading during their release calls for heightened caution. It may be reasonable to exit the market to prevent abrupt price reversals against the prevailing trend.
Beginning traders should always remember that not every trade will yield profit. Establishing a clear strategy coupled with sound money management is the cornerstone of sustained trading success.
Le recensioni analitiche di InstaForex ti renderanno pienamente consapevole delle tendenze del mercato! Essendo un cliente InstaForex, ti viene fornito un gran numero di servizi gratuiti per il trading efficiente.


