 Rimani
Condizioni di trading
Strumenti


GBP/USD also showed an upward movement on Friday. While there were only two reports for the EUR/USD pair, both of which supported the US dollar, there were three reports for the GBP/USD pair, all supporting the US dollar. In the morning, the UK released a fairly important report on retail sales, which fell by 2.3% in April. The market expected a decline of no more than 0.4%. Thus, novice traders could see that UK reports are no better than the US data, and the market mostly buys the pound without any justification, which we have been saying for six months now.
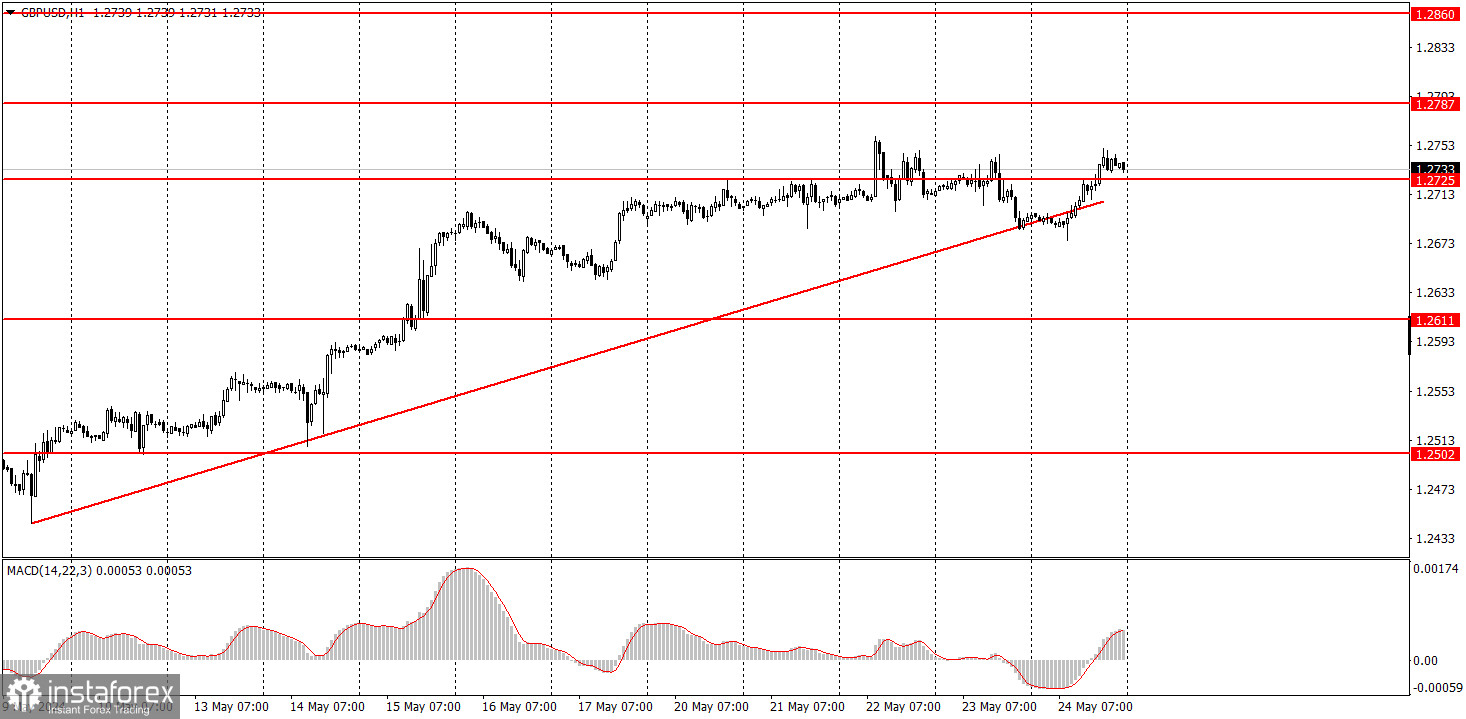
From a technical perspective, the upward trend persists, as indicated by the trend line. This trend line was broken last week, but the previous ascending trend line was also broken, after which the pair calmly resumed its uptrend. The market does not want to sell the pair, so until it sheds this reluctance, we don't expect the quotes to fall.
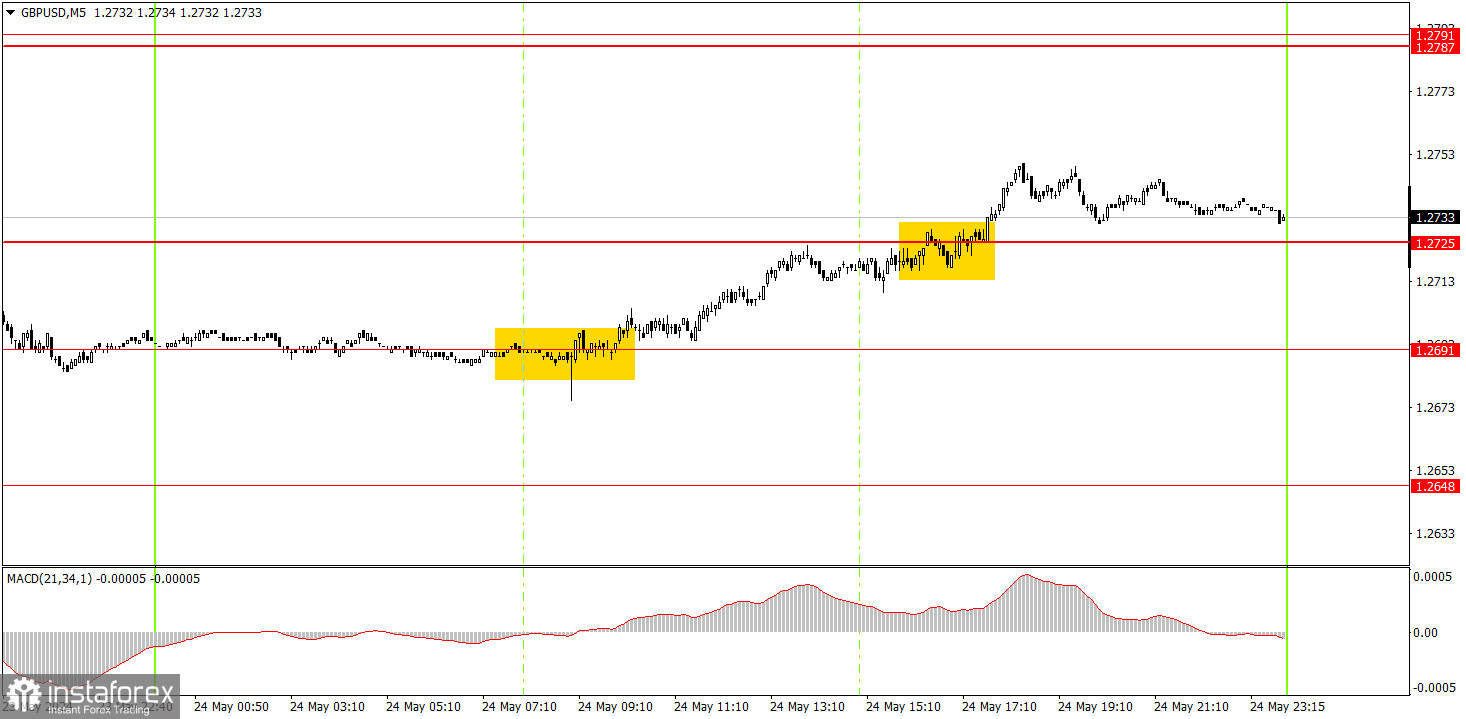
Volatility was about 75 pips on the 5-minute timeframe, which provided the opportunity for good signals to form. During the European trading session, the price bounced off the 1.2691 level, and it broke through the 1.2725 level during the US session. Thus, novice traders could have opened a long position in the morning, which should have been closed manually by the evening, as no sell signals were formed during the day. The profit from this position was about 35 pips.
On the hourly chart, the GBP/USD pair has great prospects for forming a downward trend, but the bullish correction remains intact. The fundamental backdrop continues to support the dollar much more than the British pound, but the pound continues to rise. Reports and speeches do not always support the pound, but the market interprets almost all the news in favor of the British currency.
Logically speaking, we expect the pound to fall on Monday, but considering the fact that the market doesn't need any reason to buy, the pound can still rise. Overcoming the trend line will not necessarily mean that a downward movement will follow.
The key levels on the 5M chart are 1.2270, 1.2310, 1.2372-1.2387, 1.2457, 1.2502, 1.2541-1.2547, 1.2605-1.2611, 1.2648, 1.2691, 1.2725, 1.2787-1.2791. On Monday, no significant events are scheduled in the UK or the US, so we may be in for a low-volatility flat. Alternatively, the pound may rise under any conditions and circumstances.
1) Signal strength is determined by the time taken for its formation (either a bounce or level breach). A shorter formation time indicates a stronger signal.
2) If two or more trades around a certain level are initiated based on false signals, subsequent signals from that level should be disregarded.
3) In a flat market, any currency pair can produce multiple false signals or none at all. In any case, the flat trend is not the best condition for trading.
4) Trading activities are confined between the onset of the European session and mid-way through the U.S. session, after which all open trades should be manually closed.
5) On the 30-minute timeframe, trades based on MACD signals are only advisable amidst substantial volatility and an established trend, confirmed either by a trendline or trend channel.
6) If two levels lie closely together (ranging from 5 to 15 pips apart), they should be considered as a support or resistance zone.
Support and Resistance price levels can serve as targets when buying or selling. You can place Take Profit levels near them.
Red lines represent channels or trend lines, depicting the current market trend and indicating the preferable trading direction.
The MACD(14,22,3) indicator, encompassing both the histogram and signal line, acts as an auxiliary tool and can also be used as a signal source.
Significant speeches and reports (always noted in the news calendar) can profoundly influence the price dynamics. Hence, trading during their release calls for heightened caution. It may be reasonable to exit the market to prevent abrupt price reversals against the prevailing trend.
Beginners should always remember that not every trade will yield profit. Establishing a clear strategy coupled with sound money management is the cornerstone of sustained trading success.
Le recensioni analitiche di InstaForex ti renderanno pienamente consapevole delle tendenze del mercato! Essendo un cliente InstaForex, ti viene fornito un gran numero di servizi gratuiti per il trading efficiente.

