 Rimani
Condizioni di trading
Strumenti


On Thursday, the EUR/USD currency pair showed very low volatility and limited movement. There were very few significant events or reports concerning the euro or the dollar throughout the day. The only notable report was on Eurozone retail sales, which, as expected, came in weaker than forecasted. This led to a small decline in the euro during the first half of the day, which was reasonable.
We had anticipated that the Bank of England's meeting, its results, and Andrew Bailey's speech might trigger a market reaction in the euro. However, this did not occur. The price tested the 1.0359 level, rebounded, and remained in an upward correction on the daily timeframe. As a result, nothing significant changed during Thursday's session.
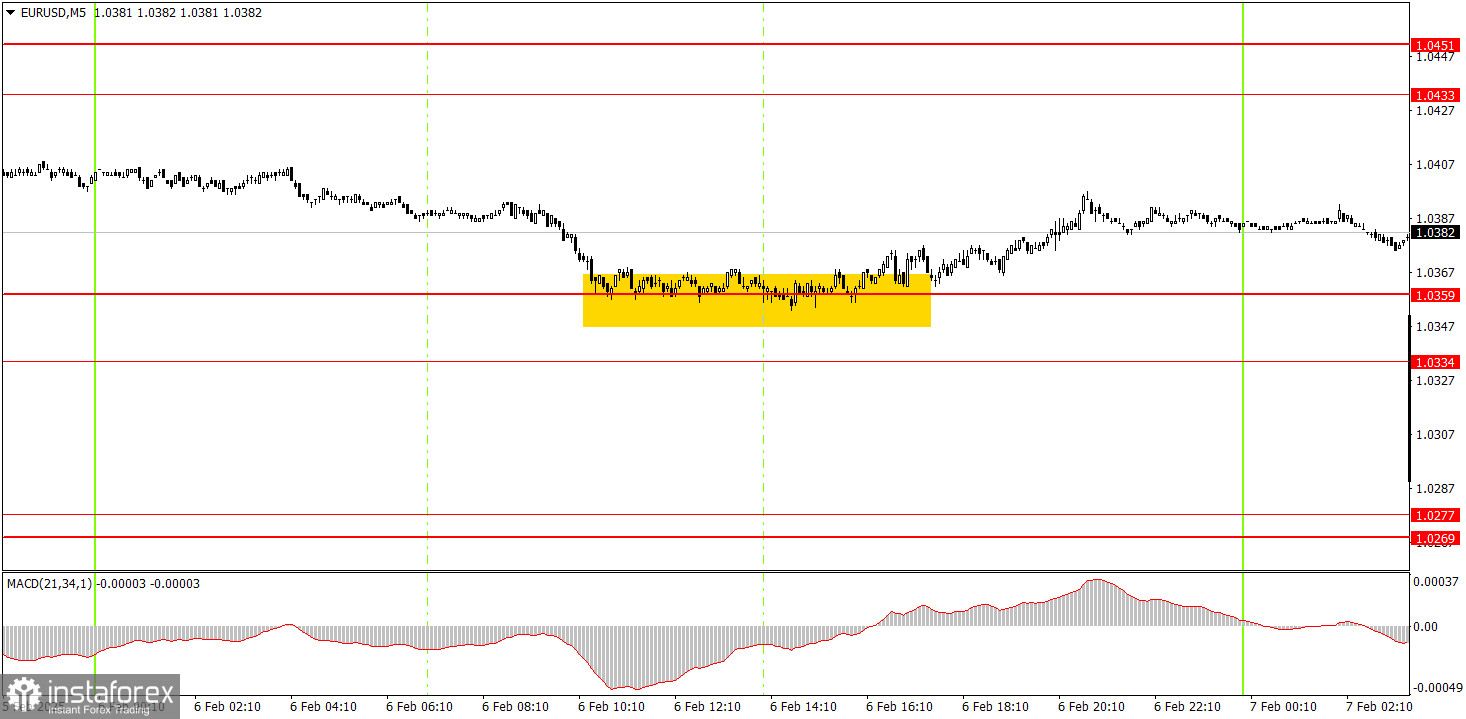
On the 5-minute timeframe, a single trading signal appeared on Thursday. During the European session, the price declined to the 1.0334–1.0359 range, where it traded for about 5 to 6 hours. Eventually, a bounce occurred; however, the signal was weak and lacked clarity. Despite this, novice traders who entered long positions based on the signal would have secured a small profit, as the currency pair moved away from this area by the end of the day.
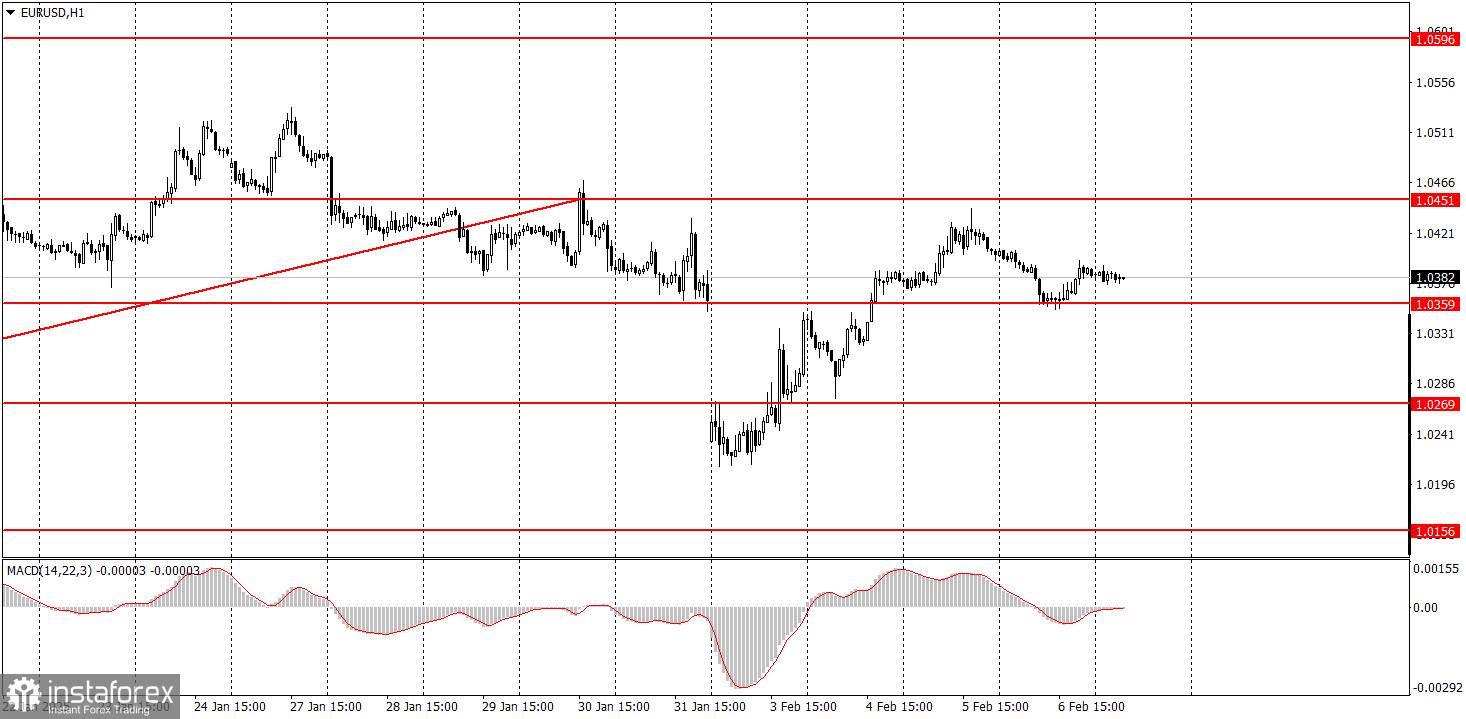
On the hourly timeframe, EUR/USD is currently in a medium-term downtrend. Although the local uptrend was invalidated, it has since resumed. We expect further declines in the euro, as the fundamental and macroeconomic conditions continue to favor the U.S. dollar. However, the upward correction on the daily timeframe may still persist for several weeks.
On Friday, the movements of the pair will largely depend on U.S. macroeconomic data, which means both a sharp decline and a strong rally are possible outcomes.
For the 5-minute timeframe, key levels to watch include: 1.0156, 1.0221, 1.0269–1.0277, 1.0334–1.0359, 1.0433–1.0451, 1.0526, 1.0596, 1.0678, 1.0726–1.0733, 1.0797–1.0804, and 1.0845–1.0851. No significant economic events are scheduled in the Eurozone on Friday. In contrast, the U.S. will release the highly anticipated Nonfarm Payrolls, unemployment rate, and the University of Michigan Consumer Sentiment Index. As a result, the main market movements and a potential surge in volatility are expected during the U.S. trading session.
Support and Resistance Levels: These are target levels for opening or closing positions and can also serve as points for placing Take Profit orders.
Red Lines: Channels or trendlines indicating the current trend and the preferred direction for trading.
MACD Indicator (14,22,3): A histogram and signal line used as a supplementary source of trading signals.
Important Events and Reports: Found in the economic calendar, these can heavily influence price movements. Exercise caution or exit the market during their release to avoid sharp reversals.
Forex trading beginners should remember that not every trade will be profitable. Developing a clear strategy and practicing proper money management are essential for long-term trading success.
Le recensioni analitiche di InstaForex ti renderanno pienamente consapevole delle tendenze del mercato! Essendo un cliente InstaForex, ti viene fornito un gran numero di servizi gratuiti per il trading efficiente.


