 Rimani
Condizioni di trading
Strumenti


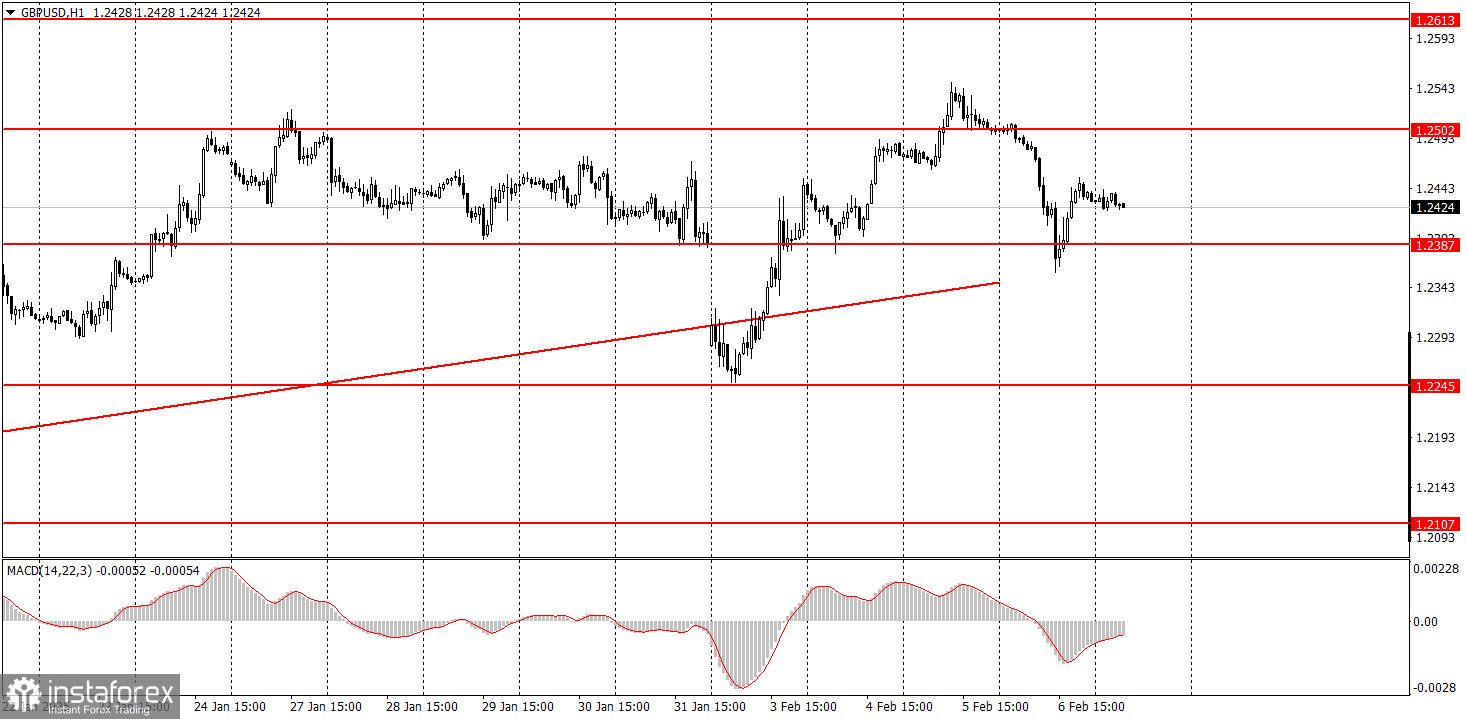
The GBP/USD pair experienced a sharp decline on Thursday, followed by a strong recovery. Despite a trendline breakout on Monday, the upward trend remains intact. Yesterday, the price rebounded precisely from this trendline, indicating that further appreciation of the British pound is expected. The Bank of England cut its key interest rate by 0.25% yesterday, a move that the market had not anticipated, making the decline predictable. Additionally, BoE Governor Andrew Bailey did not provide any supportive comments for the pound during the press conference. However, the direction of the pair today will be influenced by U.S. economic data.
From a technical perspective, the hourly chart still appears bullish. However, strong U.S. labor market and unemployment data could trigger another trendline breakout—this time, a significant one. In the short term, we maintain a bullish outlook for the pound, as the correction on the daily timeframe still appears weak.
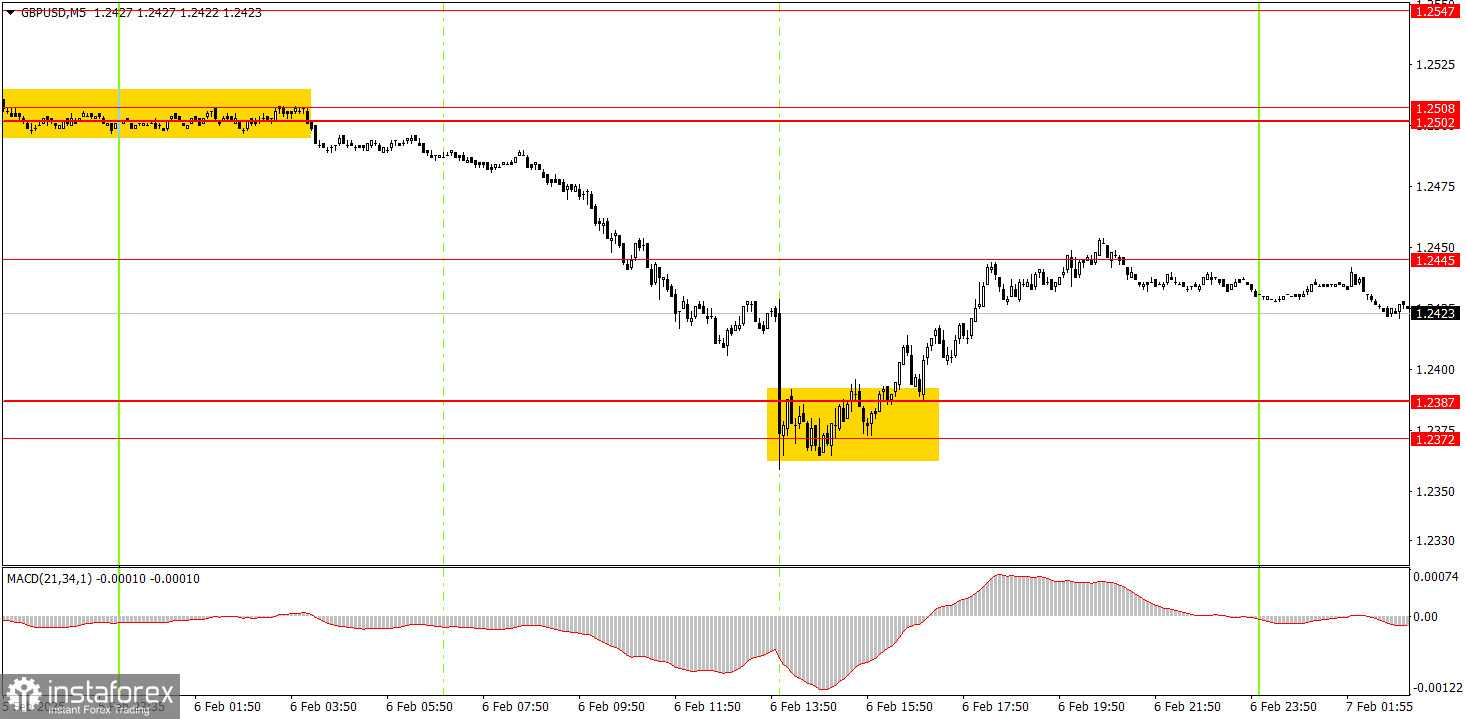
On Thursday, two near-perfect trading signals appeared within a 5-minute timeframe. Throughout the night, the trading pair bounced off the 1.2502–1.2508 zone before declining to the 1.2372–1.2387 area, where it rebounded once more. This was followed by an upward movement toward the intermediate level at 1.2445, where the price action essentially halted. As a result, novice traders had the opportunity to enter two trades, both of which were profitable, yielding a total gain of at least 120 pips.
On the hourly timeframe, GBP/USD is currently forming a short-term uptrend, but this is primarily a corrective move. In the medium term, we firmly maintain a bearish outlook, setting a target of 1.1800, as this appears to be the most logical scenario. Therefore, traders should wait for the daily timeframe correction to finish. The price action this week may be choppy and hard to interpret.
On Friday, GBP/USD could continue its upward movement; however, this will depend on weak U.S. economic data that could support such a scenario.
For the 5-minute timeframe, the key trading levels to monitor are 1.2010, 1.2052, 1.2089–1.2107, 1.2164–1.2170, 1.2241–1.2270, 1.2301, 1.2372–1.2387, 1.2445, 1.2502–1.2508, 1.2547, 1.2633, 1.2680–1.2685, 1.2723, and 1.2791–1.2798. There are no significant economic events scheduled in the UK for Friday, while the U.S. will release at least three major reports. The fate of the dollar on Friday and into the following week will largely depend on these reports.
Support and Resistance Levels: These are target levels for opening or closing positions and can also serve as points for placing Take Profit orders.
Red Lines: Channels or trendlines indicating the current trend and the preferred direction for trading.
MACD Indicator (14,22,3): A histogram and signal line used as a supplementary source of trading signals.
Important Events and Reports: Found in the economic calendar, these can heavily influence price movements. Exercise caution or exit the market during their release to avoid sharp reversals.
Forex trading beginners should remember that not every trade will be profitable. Developing a clear strategy and practicing proper money management are essential for long-term trading success.
Le recensioni analitiche di InstaForex ti renderanno pienamente consapevole delle tendenze del mercato! Essendo un cliente InstaForex, ti viene fornito un gran numero di servizi gratuiti per il trading efficiente.


