 Rimani
Condizioni di trading
Strumenti


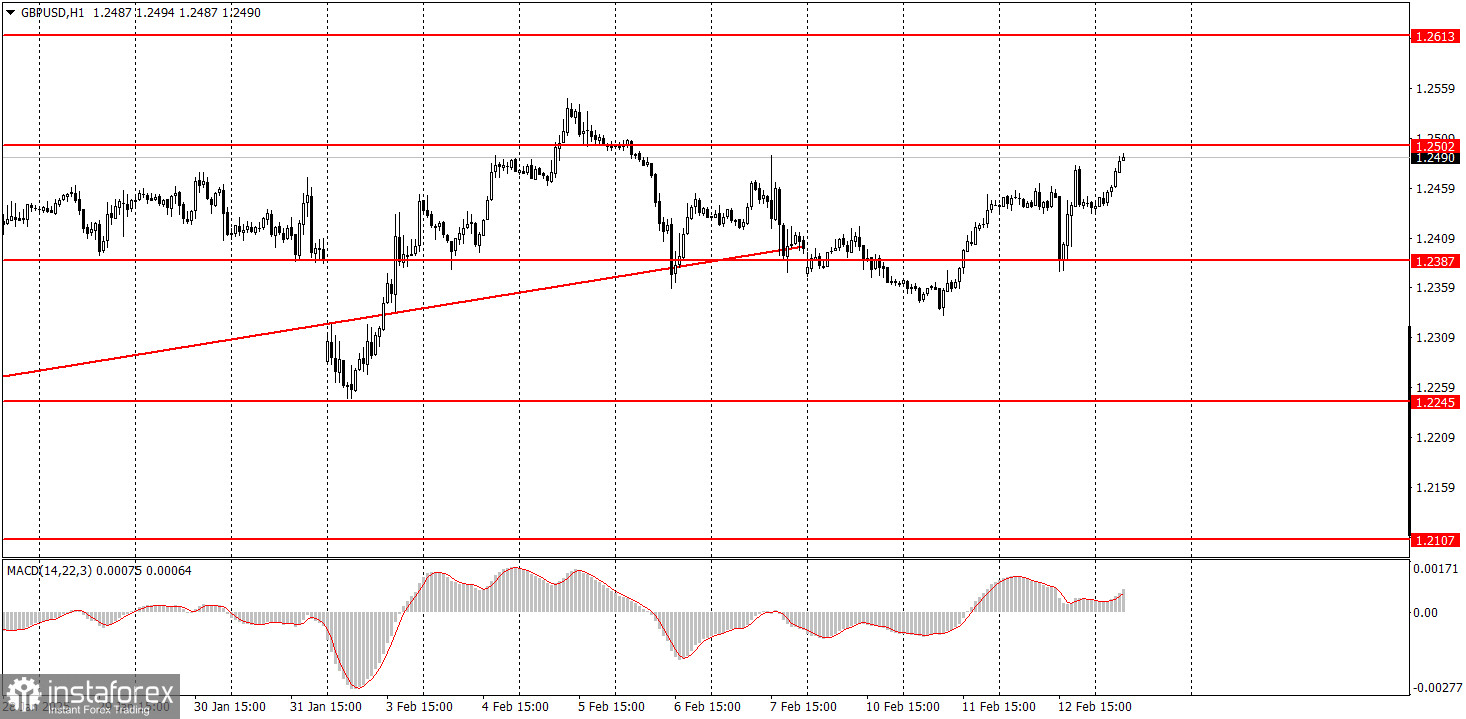
The GBP/USD pair traded higher on Wednesday, despite no reason for it. The market's reaction to the day's only significant report—U.S. inflation data—made sense only in the first five minutes, during which the dollar strengthened sharply.
In January, the Consumer Price Index (both core and headline) increased, significantly reducing the likelihood of a Federal Reserve rate cut in the near future. It also indicates that the Fed may not lower interest rates at all in 2025, a scenario we highlighted back in January. The U.S. economy remains strong, giving the Fed the flexibility to keep rates at current levels indefinitely.
Additionally, considering Donald Trump's tariff policies, inflation in 2025 could rise even further, potentially shifting the discussion from rate cuts to rate hikes. This would represent the most hawkish scenario imaginable—one that the market has clearly not factored in. However, the British pound is still in a corrective phase on the daily timeframe, which explains why we observed growth in a situation where a decline would be more logical.
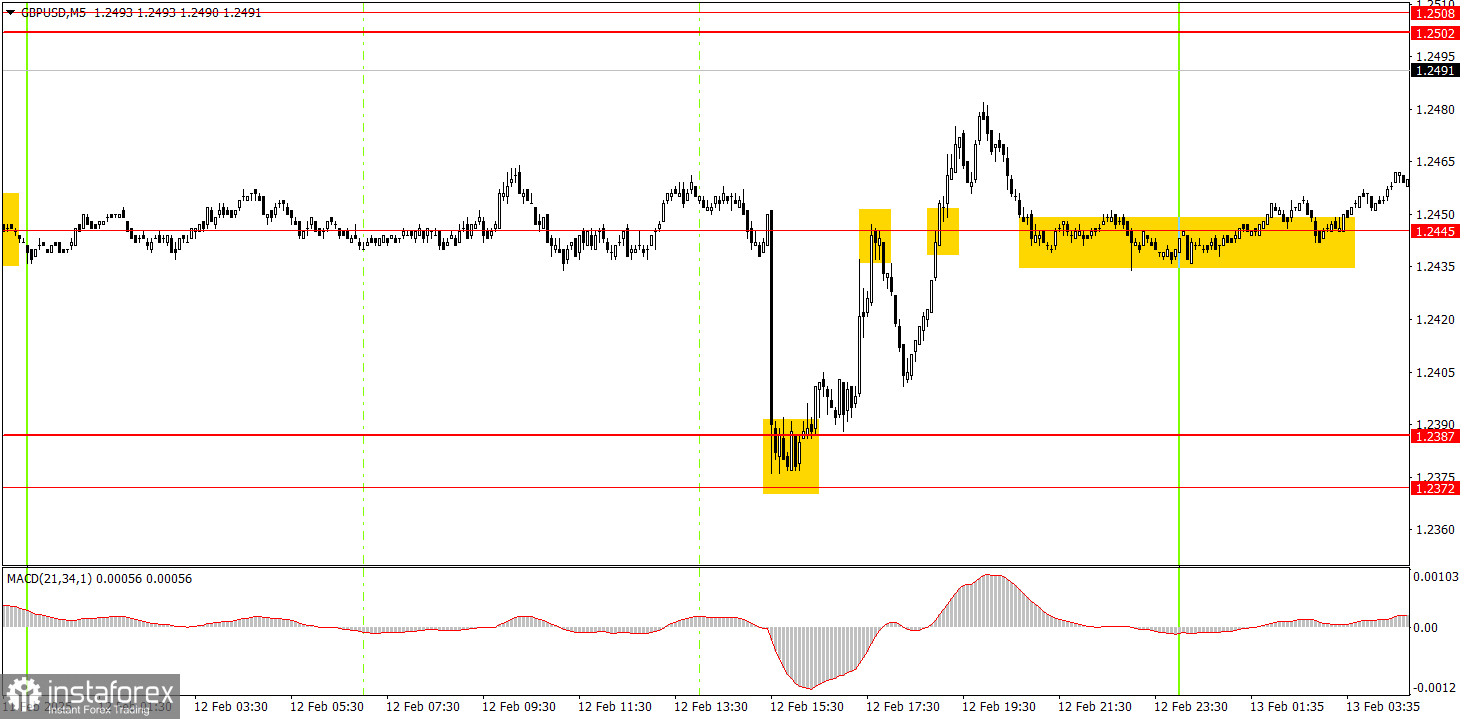
On the 5-minute timeframe on Wednesday, multiple trading signals were generated, but market movements were highly erratic. Three signals emerged during the U.S. session, and each was at least neutral (not loss-making). However, it was psychologically difficult to open long positions, knowing that the pair should logically be declining.
On the hourly timeframe, GBP/USD may be starting a new short-term downtrend, but the broader movement over the past few weeks still appears to be a correction on the daily timeframe. In the medium term, we support the outlook that GBP/USD may decline towards 1.1800, which we believe is the most logical scenario. Therefore, traders should wait for the daily correction to conclude before entering significant short positions.
On Thursday, the pair may initiate another downward move due to the current market instability. The pound rallied on Wednesday without any clear justification, and it could easily decline today. The absence of a clear rationale behind price movements continues to pose a challenge.
On the 5-minute timeframe, key trading levels to monitor are: 1.2010, 1.2052, 1.2089-1.2107, 1.2164-1.2170, 1.2241-1.2270, 1.2301, 1.2372-1.2387, 1.2445, 1.2502-1.2508, 1.2547, 1.2633, 1.2680-1.2685, 1.2723, and 1.2791-1.2798. On Thursday, the UK will release key reports on GDP and industrial production, which could trigger a market reaction. In the U.S., only two minor reports are scheduled, which are unlikely to have a significant impact on the market.
Support and Resistance Levels: These are target levels for opening or closing positions and can also serve as points for placing Take Profit orders.
Red Lines: Channels or trendlines indicating the current trend and the preferred direction for trading.
MACD Indicator (14,22,3): A histogram and signal line used as a supplementary source of trading signals.
Important Events and Reports: Found in the economic calendar, these can heavily influence price movements. Exercise caution or exit the market during their release to avoid sharp reversals.
Forex trading beginners should remember that not every trade will be profitable. Developing a clear strategy and practicing proper money management are essential for long-term trading success.
Le recensioni analitiche di InstaForex ti renderanno pienamente consapevole delle tendenze del mercato! Essendo un cliente InstaForex, ti viene fornito un gran numero di servizi gratuiti per il trading efficiente.


