 Rimani
Condizioni di trading
Strumenti


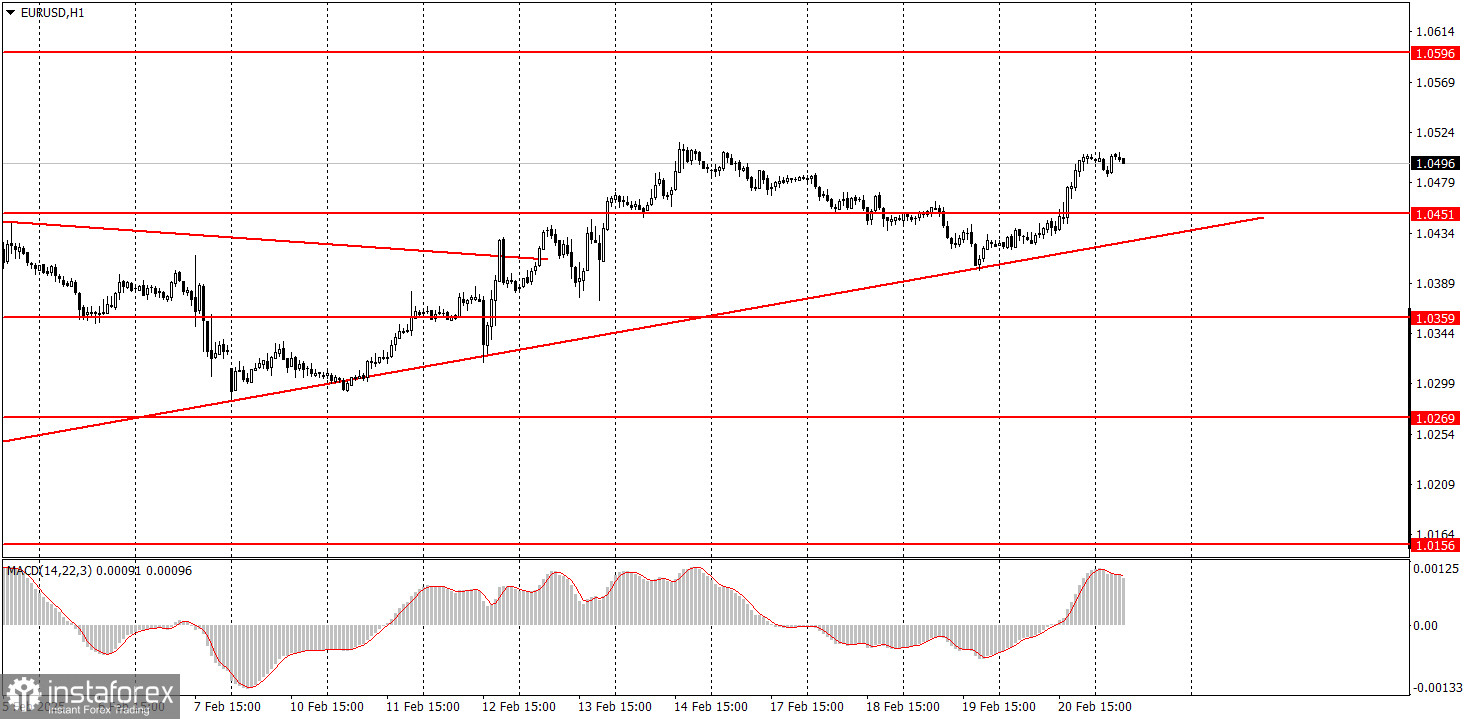
The EUR/USD currency pair continued to exhibit extremely low volatility on Thursday, primarily influenced by technical factors. After failing to break through the ascending trend line, the pair experienced a rebound, which led to another upward movement. However, it is important to note that, on the daily timeframe, the pair remains in a flat market near its upper boundary. Consequently, a downward reversal and a decline in the euro seem highly likely in the near future.
Additionally, there is almost no correlation between macroeconomic fundamentals and market movements. Yesterday, there were no significant reports from the Eurozone, and only two minor reports from the U.S. Despite this, the pair spent nearly the entire day in an upward trend. While the euro has shown steady growth, we do not believe this indicates the start of a long-term uptrend. At present, the daily timeframe remains the most informative.
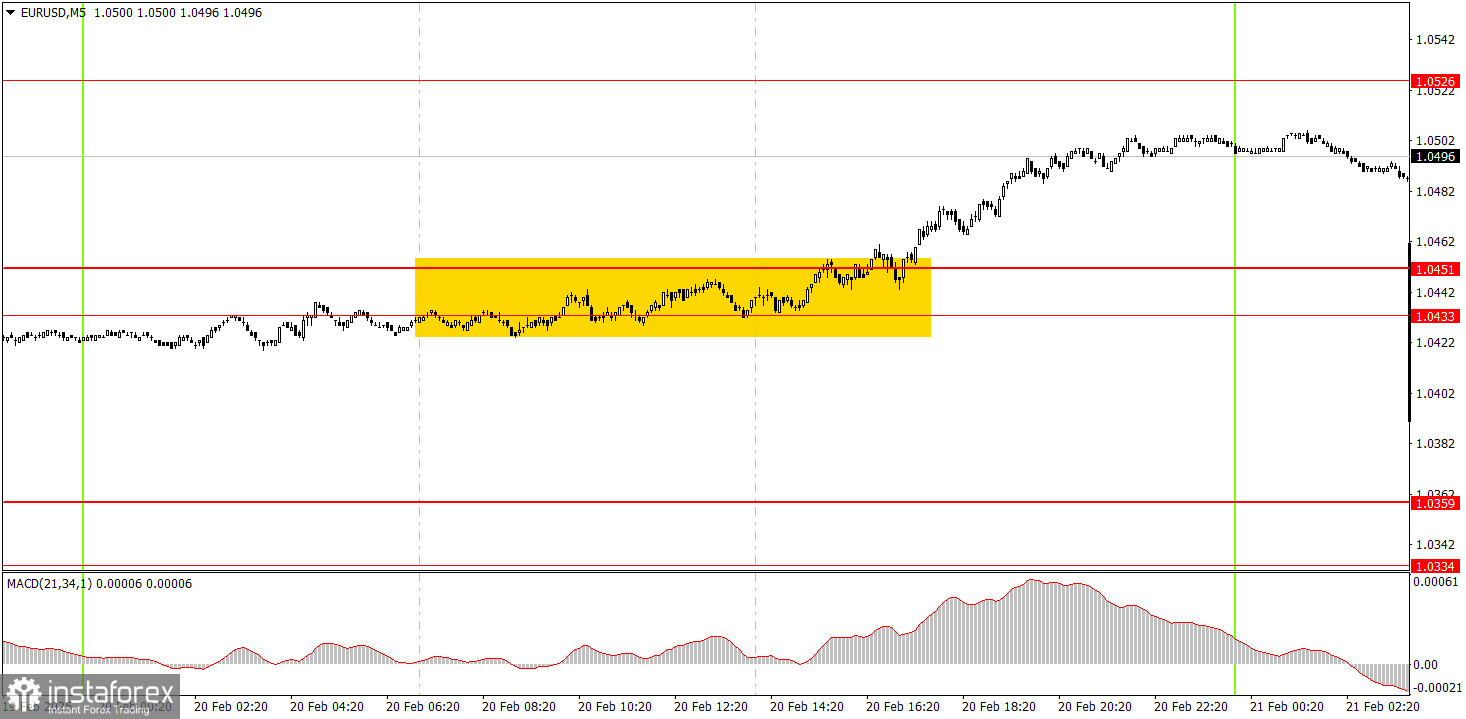
On the 5-minute chart, only one trading signal was formed on Thursday, if it can even be called a signal. During the European session, the price entered the 1.0433–1.0451 range, and the next 8-9 hours were spent attempting to consolidate above it, which eventually happened. This was followed by a continuation of the upward movement, with the euro gaining around 30 pips.
On the hourly timeframe, the EUR/USD pair is currently in a medium-term downtrend while also forming a local uptrend. A decline in the euro is anticipated as the fundamental and macroeconomic landscape continues to favor the US dollar significantly more than the euro. However, there may be an upward correction on the daily timeframe that could persist for several more weeks. On the hourly chart, we might experience several trend shifts before the primary downward movement resumes.
On Friday, the pair's movements are expected to be highly erratic but with greater volatility than in previous days. The macroeconomic backdrop today is not particularly strong, but it is extensive, featuring many reports that could influence market reactions.
On the 5-minute timeframe, the key levels to watch are 1.0156, 1.0221, 1.0269–1.0277, 1.0334–1.0359, 1.0433–1.0451, 1.0526, 1.0596, 1.0678, 1.0726–1.0733, 1.0797–1.0804, and 1.0845–1.0851. On Friday, the Eurozone, Germany, and the US will release business activity indexes, and the US will also publish the consumer sentiment index. Given the likely weak figures from the European indices, a decline in the euro appears more probable today.
Support and Resistance Levels: These are target levels for opening or closing positions and can also serve as points for placing Take Profit orders.
Red Lines: Channels or trendlines indicating the current trend and the preferred direction for trading.
MACD Indicator (14,22,3): A histogram and signal line used as a supplementary source of trading signals.
Important Events and Reports: Found in the economic calendar, these can heavily influence price movements. Exercise caution or exit the market during their release to avoid sharp reversals.
Forex trading beginners should remember that not every trade will be profitable. Developing a clear strategy and practicing proper money management are essential for long-term trading success.
Le recensioni analitiche di InstaForex ti renderanno pienamente consapevole delle tendenze del mercato! Essendo un cliente InstaForex, ti viene fornito un gran numero di servizi gratuiti per il trading efficiente.


