 Rimani
Condizioni di trading
Strumenti


Bitcoin has initiated a significant decline, which may only be the beginning of a larger bearish trend. As we have previously noted, the entire cryptocurrency market follows Bitcoin to some degree. While some altcoins may be exceptions, most trade in sync with Bitcoin, differing mainly in volatility rather than direction. Over the past few days, Bitcoin has lost 11%, while Ethereum has dropped by 16%.
There's no point in looking for separate reasons behind Ethereum's decline, as they are self-evident. The massive capital outflow from ETH ETFs is merely a consequence of Bitcoin's price drop. In other words, as large investors offloaded Bitcoin, they triggered a sell-off across Ethereum markets, leading to a significant outflow from ETH ETFs.
While the U.S. stock market can be described as "overheated," the same cannot be said for cryptocurrencies. Unlike stocks, crypto assets are not backed by tangible assets. If demand exists, prices can soar to $1 million. If demand vanishes, prices can collapse to zero—even mining costs won't prevent this, as miners will simply halt operations.
Ethereum has now returned to its yearly lows for the fourth or fifth time. Unlike Bitcoin, which has demonstrated strong growth over the past year, Ethereum has lagged behind. If Bitcoin is now entering a bearish trend, what does this imply for Ethereum's downward potential?
ETH/USD Daily Chart Analysis
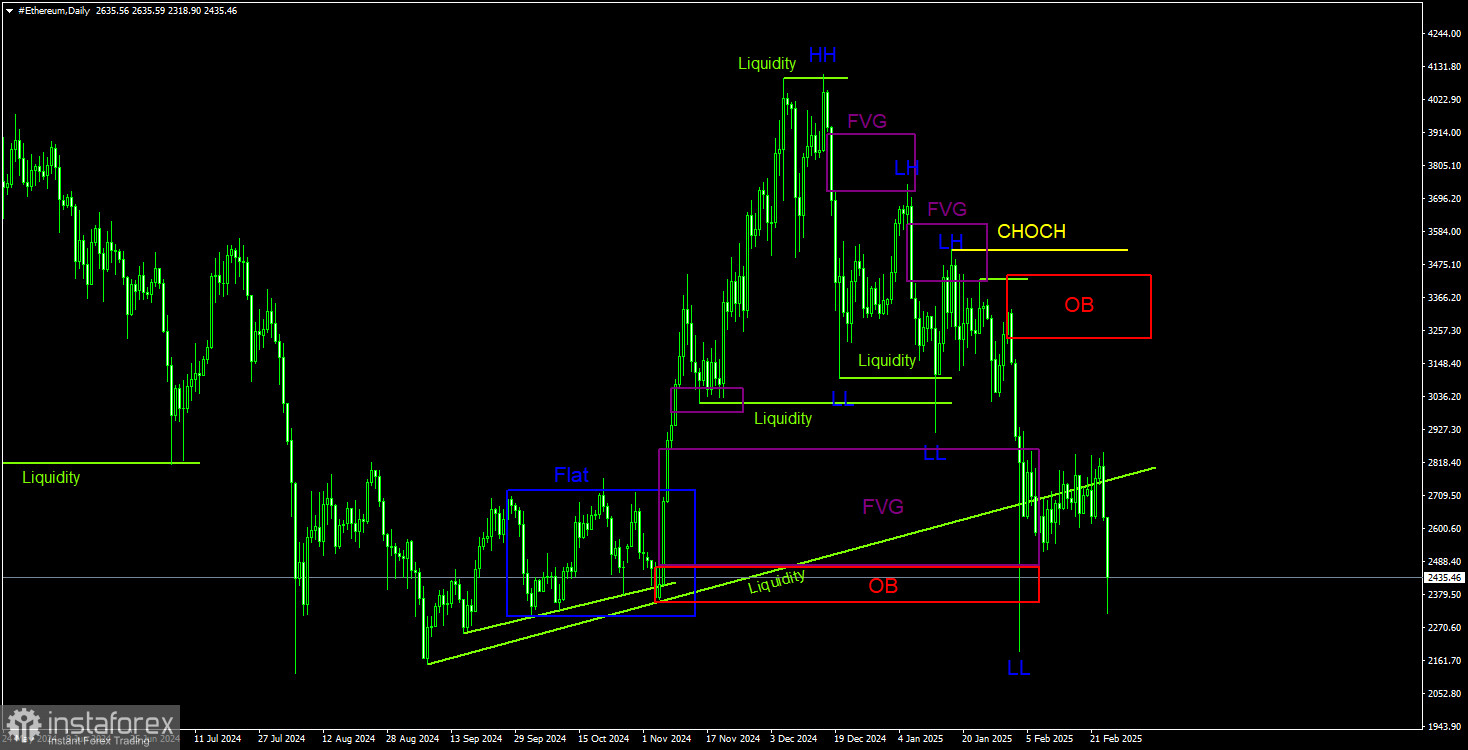
Ethereum remains in a clear downtrend on the daily timeframe. The last structural high is marked by the CHOCH (Change of Character) level. A breakout above this level would indicate a trend reversal to bullish. However, it is highly unlikely that Ethereum will return to $3,500 in the near future.
This suggests that Ethereum's decline is set to continue. The consolidation phase (flat market) has ended, as Bitcoin has broken below its range. An Order Block (OB) was formed on January 31, which may serve as a future reaction level. However, in the short term, price is unlikely to revisit those highs. The only potential support zone that could halt Ethereum's fall lies between $2,146 and $2,320.
ETH/USD 4-Hour Chart Analysis
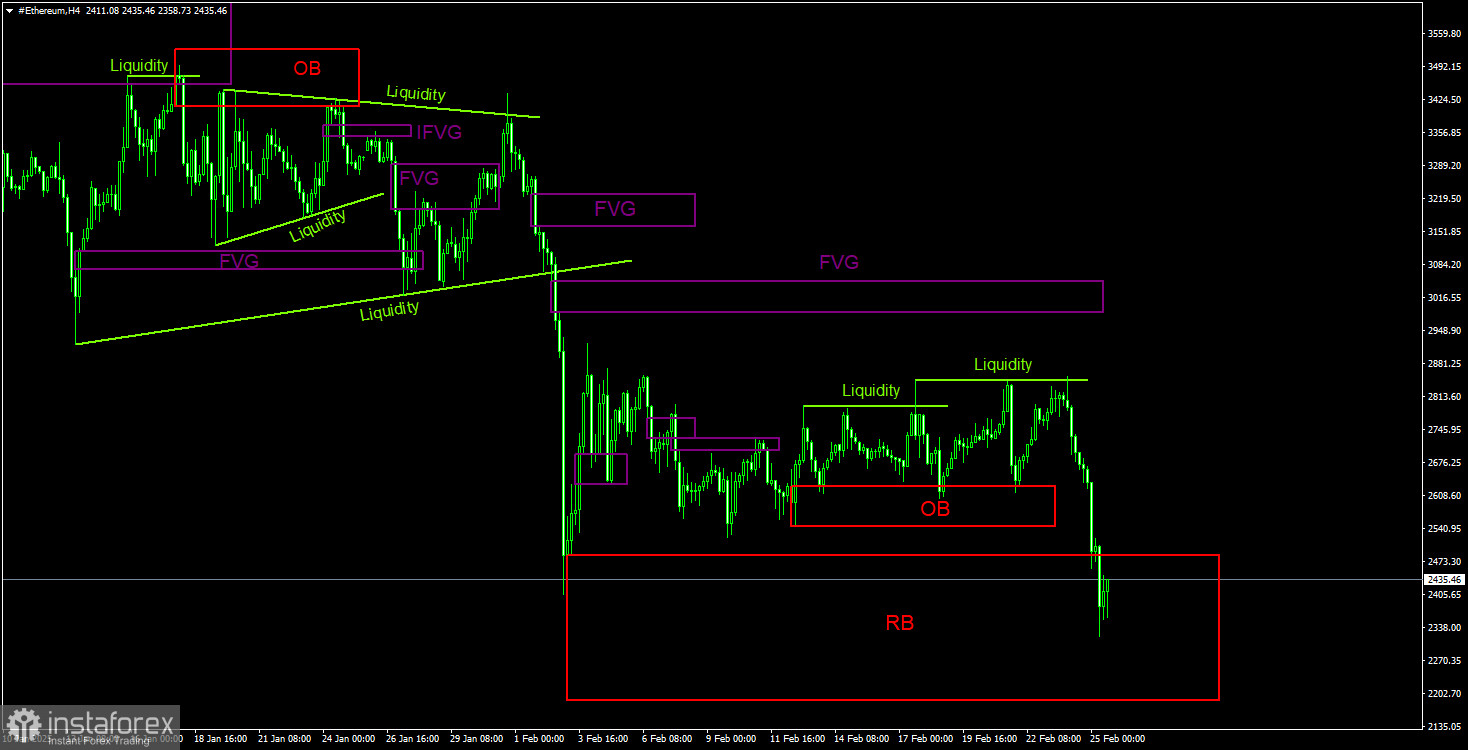
In the 4-hour timeframe, the situation appears straightforward. Unlike Bitcoin, which swept liquidity on both the buy and sell sides, Ethereum only triggered liquidity sweeps on the sell side. As expected, the midpoint of the Rejection Block has been reached, along with a major daily support zone.
This support zone could temporarily stabilize Ethereum, but if Bitcoin continues its decline, Ethereum will likely fall further as well. If Bitcoin's dominance index were decreasing, one might speculate that capital is flowing from Bitcoin to Ethereum and altcoins. However, Bitcoin's dominance remains stable, meaning that investors are not rotating into Ethereum.
Ethereum Trading Strategy (ETH/USD)
Ethereum continues to trend downward, so the primary focus remains on selling opportunities rather than buying setups. The liquidity sweeps at recent highs signaled that Ethereum was preparing for a decline, though Bitcoin's signals were less clear-cut.
At this stage, the key factors to watch are Bitcoin's movements and the emergence of new trading patterns, liquidity sweeps, and confirmation signals. Over the past two days, multiple Fair Value Gaps (FVGs) have formed. However, it is not useful to analyze each individually, as that would create an overly broad range of potential trade setups. Instead, the ideal FVG setup should be a clear three-candle formation with a decisive structure.
Key ICT Concepts Used in the Chart Analysis
Le recensioni analitiche di InstaForex ti renderanno pienamente consapevole delle tendenze del mercato! Essendo un cliente InstaForex, ti viene fornito un gran numero di servizi gratuiti per il trading efficiente.


