 Rimani
Condizioni di trading
Strumenti


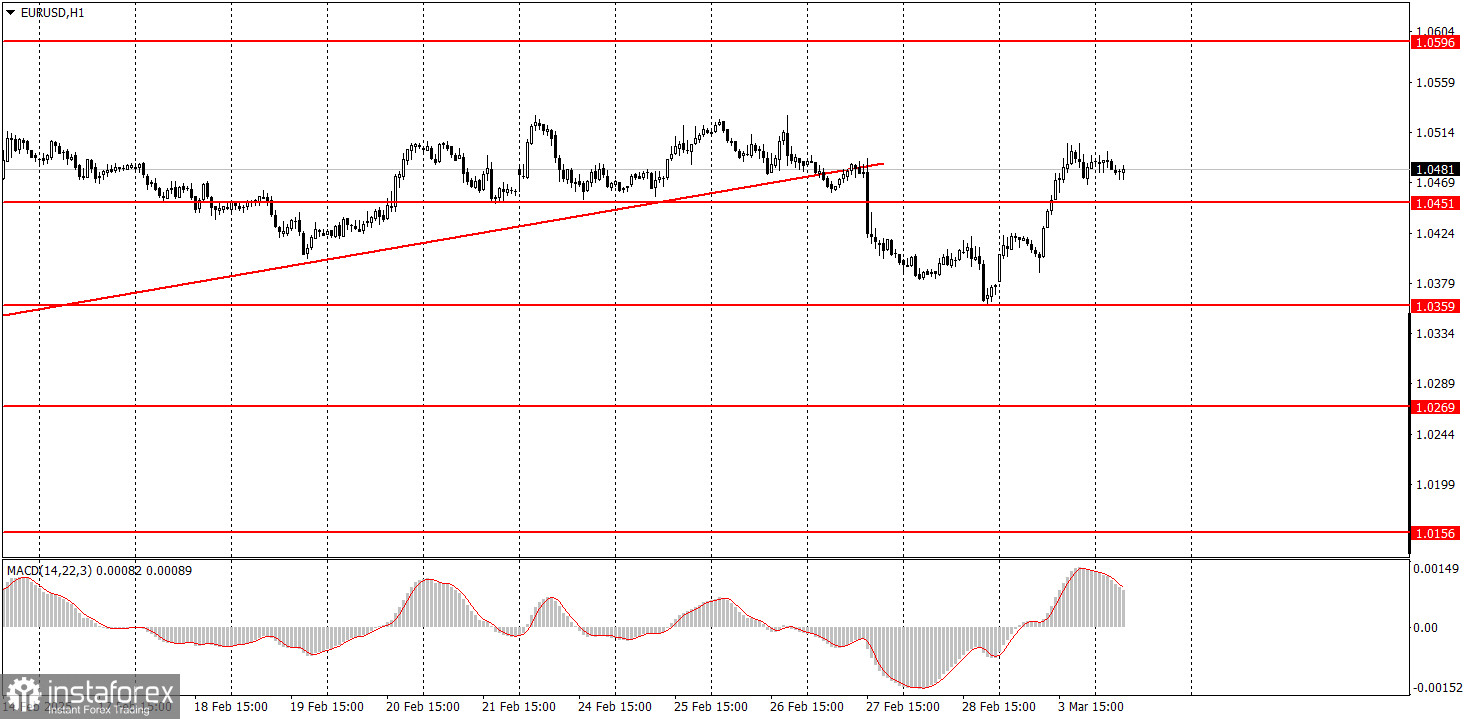
The EUR/USD pair experienced a strong rally on Monday, which contradicted the expected technical picture. Last week, the ascending trendline was broken, and the price failed to surpass the 1.0526 level, which serves as the upper boundary of the sideways channel on the daily timeframe. A decline appeared to be the most likely scenario for this week; however, the market opened with gains.
We had cautioned that events occurring at the White House on Friday would be reflected in Monday's market movements. Throughout the day, the U.S. dollar weakened, making it unlikely that the inflation reports from the EU or the business activity indices from the EU, Germany, and the U.S. were the main drivers of this movement. EU inflation slowed less than expected, which is a positive sign for the euro, while the key ISM Manufacturing PMI in the U.S. came in weaker than forecasted. Nonetheless, we emphasize that macroeconomic factors were not the reason behind the dollar's decline.
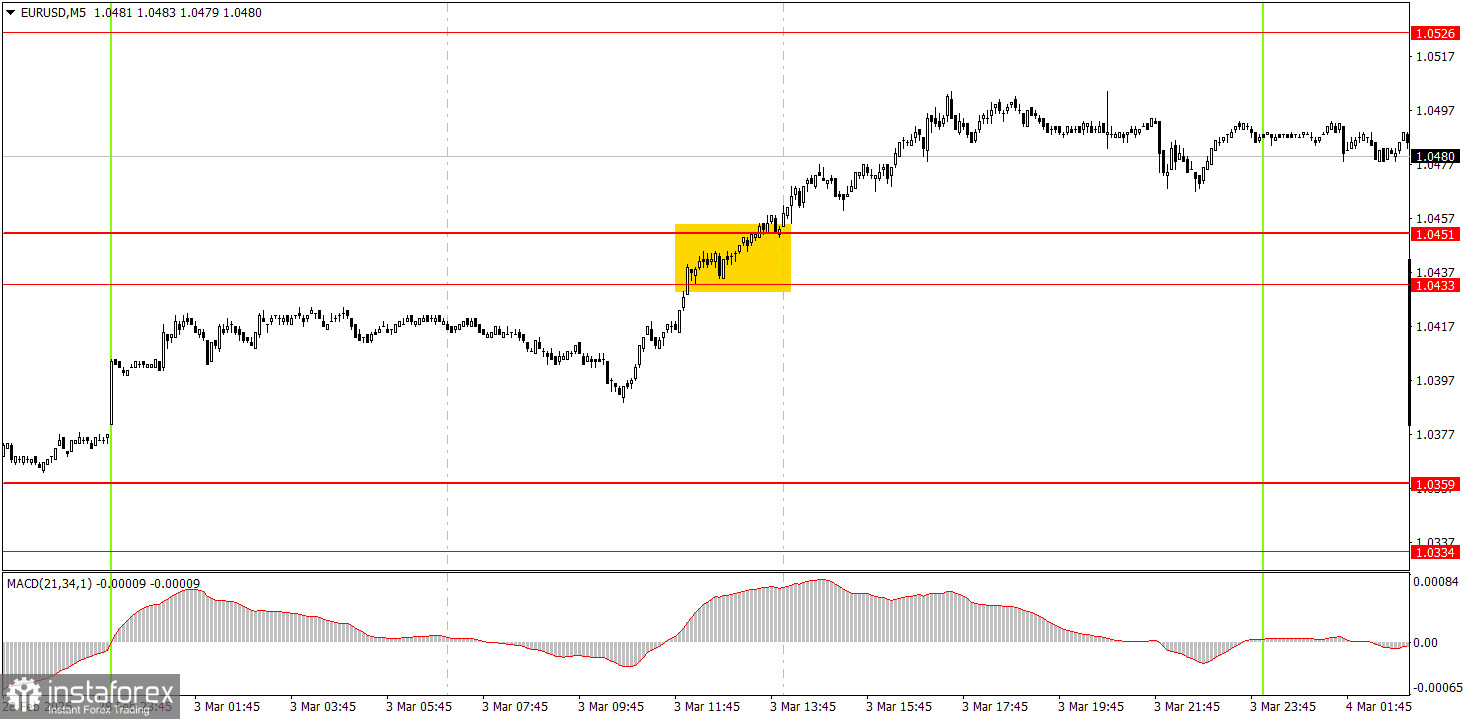
On the 5-minute chart of EUR/USD, only one trading signal was generated on Monday. The price had already bounced off the 1.0359 level on Friday evening, but no one could have anticipated the White House scandal, which triggered a significant rally on Monday. Long positions could have been initiated after the price broke above the 1.0451 level, although potential profits would have been limited to about 30 pips.
On the hourly timeframe, the EUR/USD pair remains in a medium-term downtrend and a sideways range on the daily chart. As before, a decline in the euro is expected, given that fundamental and macroeconomic factors continue favoring the U.S. dollar over the euro. The hourly timeframe may see a few short-term trends before the overall downtrend resumes, but soon, we anticipate a local decline.
On Tuesday, the euro may begin to decline. Trump has imposed new tariffs on China, and Monday's euro rally was not entirely logical. Moreover, the sideways range on the daily timeframe and the break of the ascending trendline on the hourly chart suggest a downward move.
On the 5-minute timeframe, key levels to watch include 1.0156, 1.0221, 1.0269-1.0277, 1.0334-1.0359, 1.0433-1.0451, 1.0526, 1.0596, 1.0678, 1.0726-1.0733, 1.0797-1.0804, and 1.0845-1.0851. The eurozone unemployment report will be released on Tuesday, the only significant macroeconomic event of the day. However, fresh statements from Donald Trump could create additional volatility in the market.
Support and Resistance Levels: These are target levels for opening or closing positions and can also serve as points for placing Take Profit orders.
Red Lines: Channels or trendlines indicating the current trend and the preferred direction for trading.
MACD Indicator (14,22,3): A histogram and signal line used as a supplementary source of trading signals.
Important Events and Reports: Found in the economic calendar, these can heavily influence price movements. Exercise caution or exit the market during their release to avoid sharp reversals.
Forex trading beginners should remember that not every trade will be profitable. Developing a clear strategy and practicing proper money management are essential for long-term trading success.
Le recensioni analitiche di InstaForex ti renderanno pienamente consapevole delle tendenze del mercato! Essendo un cliente InstaForex, ti viene fornito un gran numero di servizi gratuiti per il trading efficiente.


